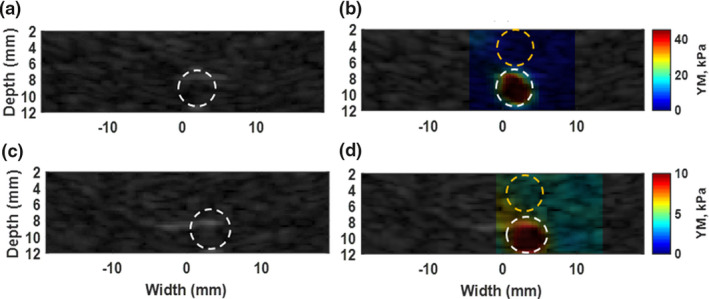
Figure 2.

(a) B‐mode image of phantom with stiff inclusion. (b) Overlaid image of reconstructed 2D Young's modulus map on original B‐mode in phantom with a stiff inclusion. The estimated E, for background part specified with dashed yellow circle is 4.8 ± 0.9 kPa. the dashed white circle shows the inclusion part and E = 41.5 ± 9.8 kPa. (c) B‐mode image of phantom with soft inclusion. (d) Overlaid image of reconstructed 2D Young's modulus map on original B‐mode in phantom with a stiff inclusion. The estimated E, for background part specified with dashed yellow circle is 4.3 ± 0.3 kPa. The dashed white circle shows the lesion part and E = 10.1 ± 1 kPa. [Color figure can be viewed at wileyonlinelibrary.com]
