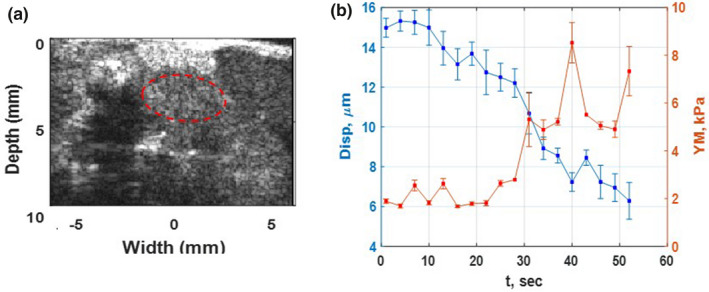
Figure 5.

(a) High‐resolution B mode image of PDA Tumor and surrounding organs of the first in vivo mouse study using L 22‐14 V probe. The tumor is specified with a dashed red oval shape. (b) The absolute peak‐to‐peak displacement and Young's modulus temporal profiles of tumor, red dashed oval, in part (a) of this figure during HIFU application for 54 s. [Color figure can be viewed at wileyonlinelibrary.com]
