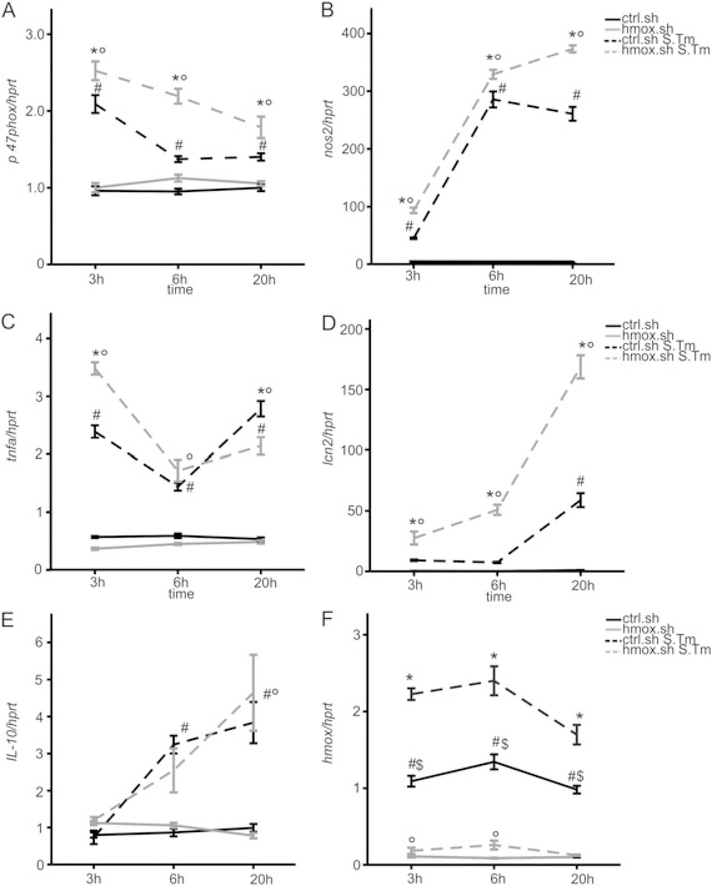
Fig. 3. Effects of hmox gene knockdown on p47phox, nos2, tnfa, II-10 and lcn2 transcript expression.
Ctrl.sh (black line) and hmox.sh (grey line) macrophages infected with Salmonella (black or grey dashed line) were subjected to qRT-PCR at indicated time points. Expression of genes of interest was normalized to hprt expression and fold-change relative to untreated control is shown. Data from three independent experiments (n = 10 ctrl.sh; n = 8 hmox. sh) are shown. Error bars represent means ± SEM, values are reported as determined by ANOVA using Bonferroni’s correction. * $ P < 0.001 for hmox.sh versus ctrl.sh, both infected with S. Tm (*) or both uninfected ($); ° P < 0.001 for hmox.sh uninfected versus infected with S. Tm; # P < 0.001 for comparison of ctrl.sh and ctrl.sh infected with S. Tm.

