
Fig. 2.
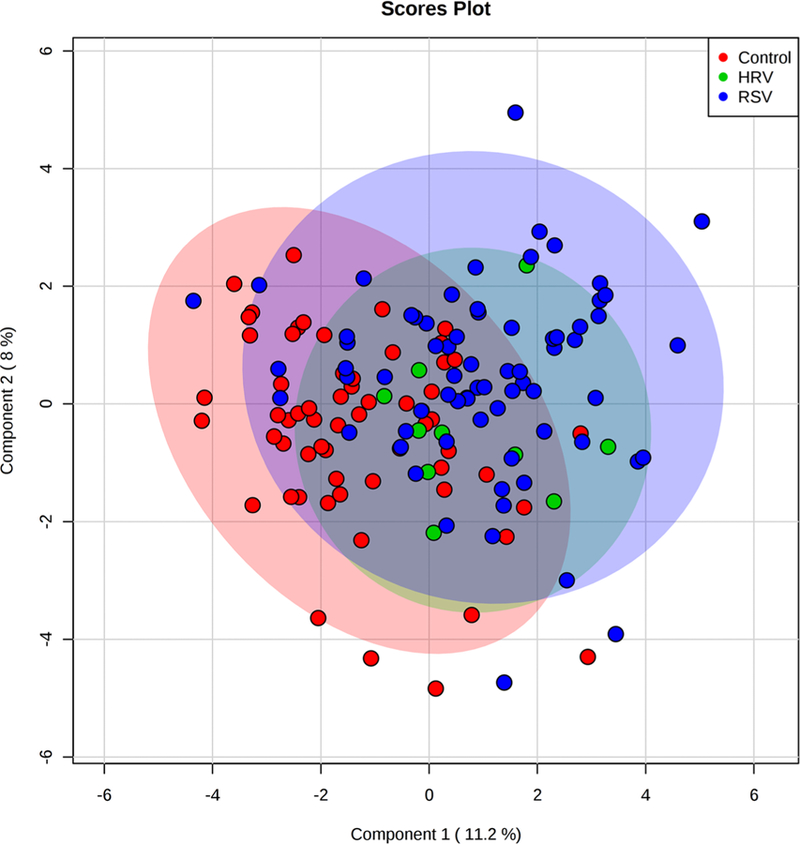
Partial least square discriminant analysis (PLS-DA) score plot showing the first two components of the urine sample projection based on the 31 metabolites identified in the unmatched data. The red, orange, and blue shaded ovals show the classification of the samples into healthy controls, human rhinovirus (HRV) ARI, and respiratory syncytial virus (RSV) ARI, respectively, based on the first two components of PLS-DA