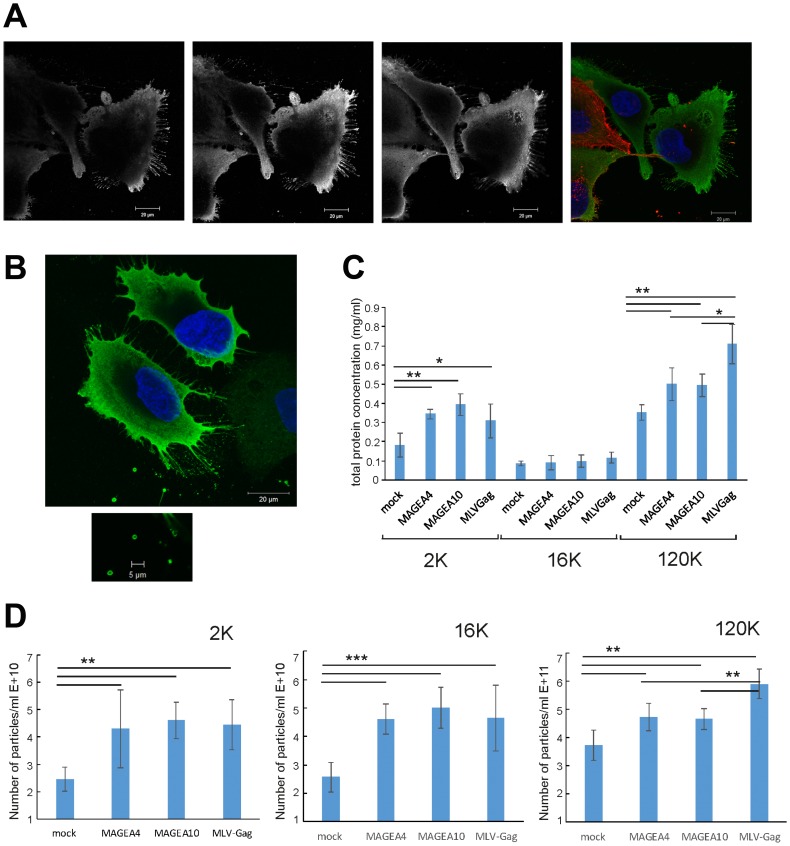
Figure 6. MAGEA proteins induce shedding and budding of EVs from cells.
(A, B) MAGEA4 protein was overexpressed in U2OS cells and the cells were analysed by indirect immunofluorescence microscopy using MAGEA4 (green) and beta-actin (red) antibodies. Three Z-stack images (grey) and the merge picture is shown. DAPI was used to stain the nucleus. (C) The amount of total protein of EVs isolated from COP5 cells transfected with MAGEA and MLVGag proteins. Average of five experiments with standard deviations is shown. The p-value is below 0.05 (*) or below 0.01 (**) using Students paired t-test with a two-tailed distribution. (D) The amount of EVs isolated from COP5 cells transfected with MAGEA and MLVGag proteins analyzed by NTA. Average of eight measurements from four different experiments with standard deviations is shown. The p-value is below 0.005 (**) or below 0.001 (***) using Students paired t-test with a two-tailed distribution.

