Figure 4.

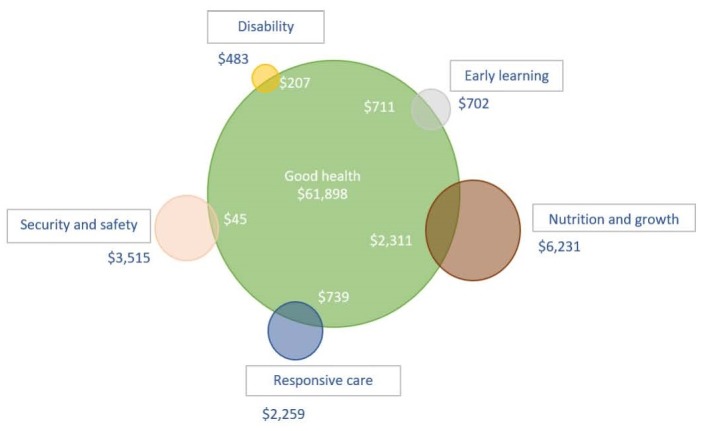
Venn diagram showing proportionate overlap of disbursements between good health and other domains of the Nurturing Care Framework (millions of constant US dollars).

Venn diagram showing proportionate overlap of disbursements between good health and other domains of the Nurturing Care Framework (millions of constant US dollars).