
Figure 1. Body weight, food intake and liver weight.
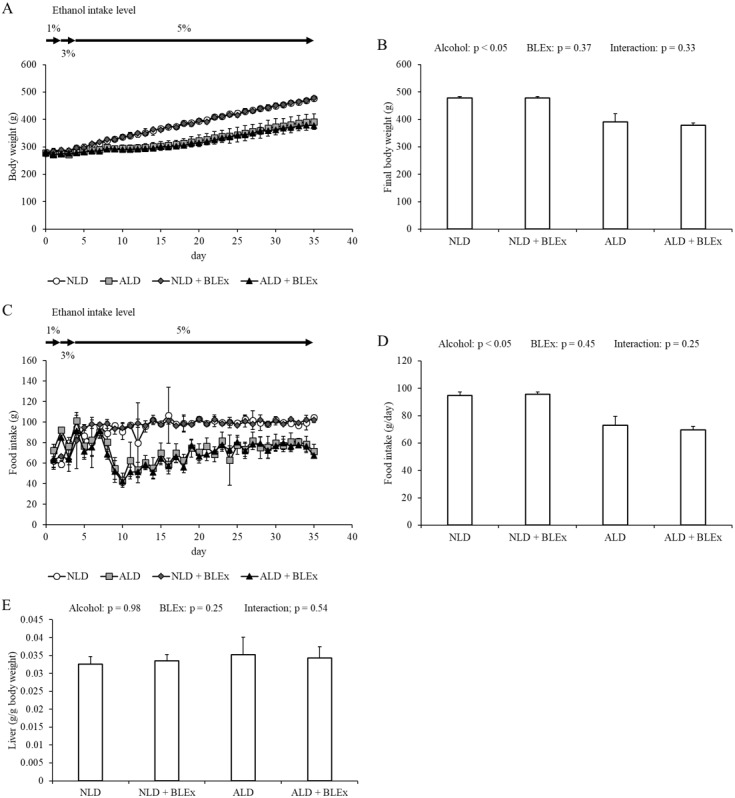
(A) Changes in body weight, (B) final body weight, (C) food intake change, (D) daily food intake, and (E) liver weight in rats (n = 5). The values are expressed as the mean ± SD.
Official websites use .gov
A
.gov website belongs to an official
government organization in the United States.
Secure .gov websites use HTTPS
A lock (
) or https:// means you've safely
connected to the .gov website. Share sensitive
information only on official, secure websites.
(A) Changes in body weight, (B) final body weight, (C) food intake change, (D) daily food intake, and (E) liver weight in rats (n = 5). The values are expressed as the mean ± SD.