
Figure 4. Liver carbonyl protein level and HO-1 mRNA expression in the liver.
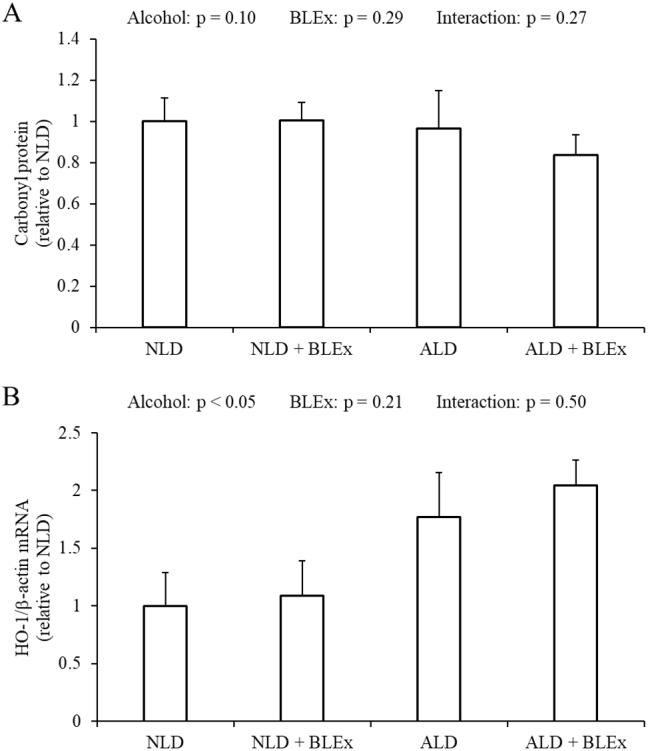
(A) Liver carbonyl protein level and (B) HO-1 mRNA expression in rats (n = 5). The values are expressed as the mean ± SD.
Official websites use .gov
A
.gov website belongs to an official
government organization in the United States.
Secure .gov websites use HTTPS
A lock (
) or https:// means you've safely
connected to the .gov website. Share sensitive
information only on official, secure websites.
(A) Liver carbonyl protein level and (B) HO-1 mRNA expression in rats (n = 5). The values are expressed as the mean ± SD.