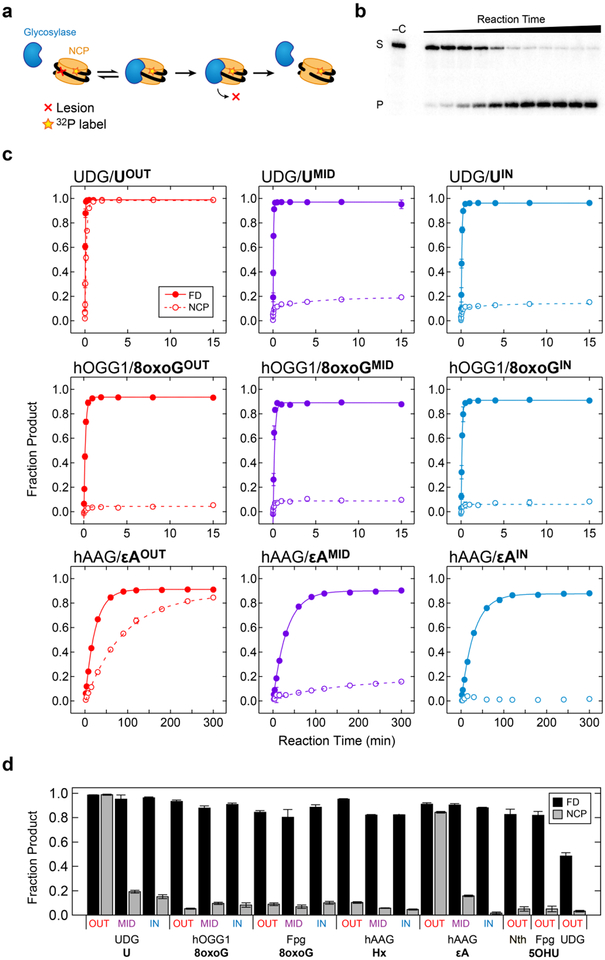
Figure 4.
Single turnover kinetics time courses. a) A schematic of the glycosylase reaction. b) A typical 8% denaturing PAGE gel showing the conversion of substrate (S) to product (P) with increasing reaction time. c) Reaction time courses for UDG/U, hOGG1/8oxoG, and hAAG/εA systems for free duplex (closed circles) or NCP (open circles) substrates. Data were fit using nonlinear least-squares regression. Error bars represent the standard deviation (n = 3). d) Maximum product yield observed in kinetics time courses for free duplex (FD; black) and NCP (gray) substrates.

