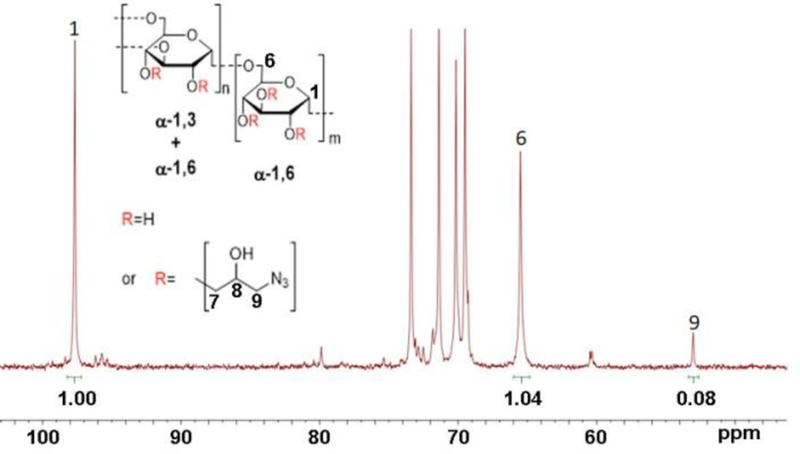
Figure 2.

13C NMR spectrum of azidified dextran. Ratio of integrals of the peaks 9 and 1 gives the fraction of modification of sugar units by azide groups. Acquisition parameters: 100 MHz, D2O, time delay=15 s, 8000 scans. Insert: schematic structure of azidified dextran showing α−1,6 glycosidic linkages between glucose monomers with branches from α−1,3 linkages. The numbering of the carbon in the dextran structure corresponds to the corresponding peak numbering in the NMR spectrum.
