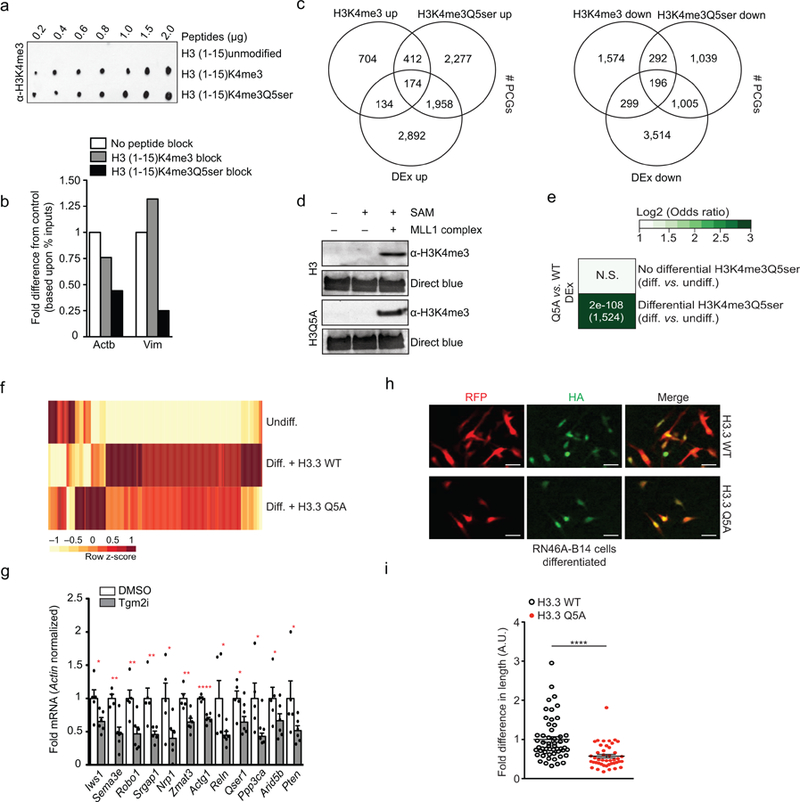
Extended Data Figure 8. Functional validations of H3 serotonyl’s role in permissive gene expression.

a, Peptide dot blot titrations testing the ability of the α-H3K4me3 antibody to detect the mark in the absence or presence of Q5ser; note that Q5ser does not occlude antibody recognition of the mark. Results confirmed in ≥ 2 independent experiments. b, Peptide competition qChIP validation of H3K4me3Q5ser’s enrichment at two target loci (Actb and Vim) identified via ChIP-seq in RN46A-B14 cells (undifferentiated, n=1/group). c, Overlap of differential enrichment events at protein-coding genes for H3K4me3 and H3K4me3Q5ser vs. differential gene expression (DEx) in response to RN46A-B14 cell differentiation indicates positive correlations between H3K4me3Q5ser gene expression in the absence of significant changes in H3K4me3 enrichment (FDR<0.05, FC>1.2 cutoffs applied after adjusting for multiple comparisons–n=3 independent biological replicates/differentiation state/antibody). d, Recombinant methylation assays (MLL1 complex mediated) on wildtype H3 vs. H3Q5A, followed by WB for H3K4me3, indicating that the Q5A mutation does not affect methylation capacity at K4. DB was used to control for protein loading. Results confirmed in ≥ 2 independent experiments. e, Odds ratio analysis (using Fisher’s exact tests) of overlapping genes displaying differential H3K4me3Q5ser enrichment (or not) vs. differential gene expression [DEx, n=5 (H3.3 WT) vs. 6 (H3.3Q5A) independent biological replicates/virus], FDR<0.05 cutoff applied after adjusting for multiple comparisons) comparing differentiated RN46A-B14 cells expressing either H3.3 WT or H3.3Q5A. Insert numbers indicate respective p values for associations, followed by the number of protein-coding genes overlapping per significant category. f, Heat map of RNA-seq data comparing undifferentiated vs. differentiated (n=5 H3.3 WT vs. 6 H3.3Q5A expressing) RN46A-B14 cells using normalized RNA expression values (averaged between replicates) to generate z-scores for each row. Represented are those genes that displayed differential enrichment during differentiation, along with altered gene expression (see Fig. 3), along with opposing regulation in the context of H3.3Q5A. These genes were found to significantly enrich for pathways associated with axon guidance signaling via Kegg Analysis (see Supplementary Data Table 28). g, qPCR analysis of candidate gene expression in RN46A-B14 cells (n=5 DMSO vs. 6 LDN 27219/Tgm2i; one-tailed student’s t-test; Iws1: t9=2.559, *p=0.0154, Sema3e: t8=3.982, **p=0.0020, Robo1: t9=3.344, **p=0.0043, Srgap1: t8=3.312, **p=0.0053, Nrp1: t9=2.452, *p=0.0183, Zmat3: t9=3.820, **p=0.0020, Actg1: t8=7.836, ****p<0.0001, Reln: t9=2.209, *p=0.0273, Qser1: t8=2.513, *p=0.0181, Ppp3ca: t8=2.418, *p=0.0210, Arid5b: t9=1.754, *p=0.0567, Pten: t9=1.936, *p=0.0424). Actin was used as a normalization control. h, Immunofluorescence images (scale bars equal 20 μm) of RN46A-B14 cells infected during differentiation with lentiviruses expressing either wildtype H3.3-HA or H3.3Q5A-HA. Results confirmed on ≥ 3 independent coverslips/viral treatment. i, Neurite outgrowth analysis examining RN46A-B14 cellular length post-differentiation (n=54 H3.3 WT vs. 44 H3.3 Q5A expressing cells; two-tailed student’s t-test, t96=4.664, ****p<0.0001). Data presented as average ± SEM.
