
Figure 3. H3K4me3Q5ser, independently from H3K4me3, correlates with permissive gene expression during cellular differentiation.
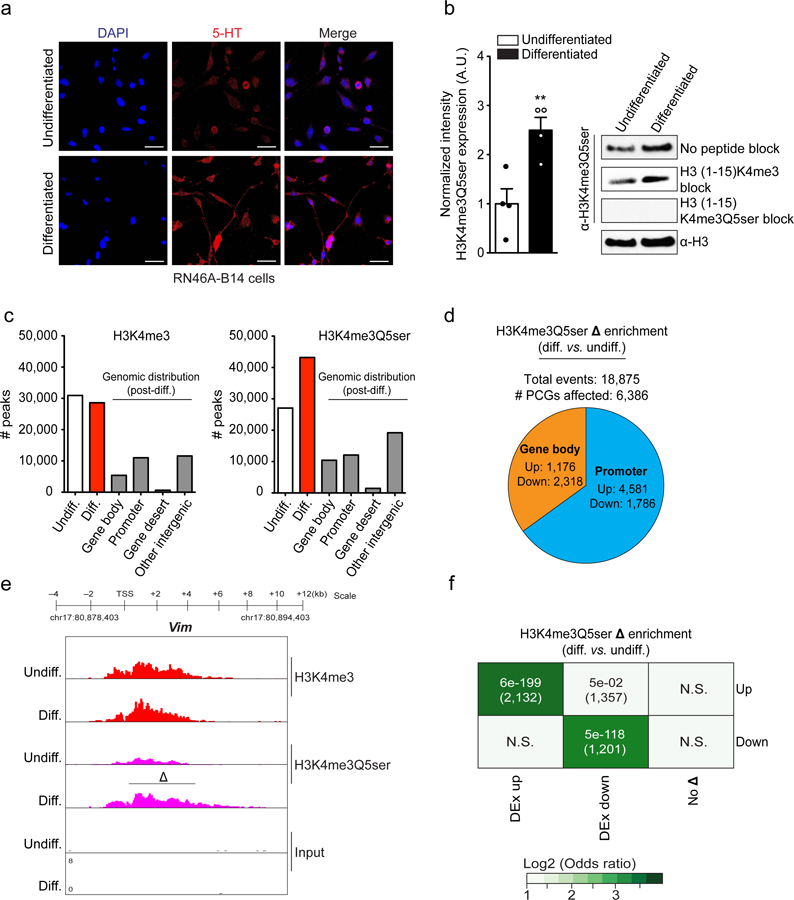
a, Immunofluorescence images of 5-HT in RN46A-B14 cells overlayed with a nuclear co-stain (DAPI) pre- and post-differentiation. Scale bars equal 20 μm. Results confirmed in ≥ 3 independent experiments b, Quantitative WB analysis of H3K4me3Q5ser expression in RN46A-B14 cells pre- vs. post-differentiation (two-tailed Student’s t-test, n=4/group; t6=3.736, **p=0.0097). H3 was used a loading control.. c, MACSv2.1.1-based peak calling for H3K4me3 vs. H3K4me3Q5ser ChIP-seq data pre- and post-differentiation in RN46A-B14 cells (FDR<0.05, FC>1.2 cutoffs applied after adjusting for multiple comparisons–n=3 independent biological samples/pre- vs. post-differentiation; normalized to respective inputs). d, Analysis of H3K4me3Q5ser differential enrichment comparing RN46A-B14 cells pre- vs. post-differentiation (FDR<0.05, FC>1.2 cutoffs applied after adjusting for multiple comparisons–n=3 independent biological samples/pre- vs. post-differentiation). Pie chart indicates distribution of genic differential enrichment events for the mark comparing promoter vs. gene body regions. e, Genome browser tracks of the Vim locus for H3K4me3 and H3K4me3Q5ser (vs. DNA input) in RN46A-B14 cells pre- and post differentiation. Δ indicates a statistically significant site of differential enrichment for H3K4me3Q5ser as determined by diffReps (n=3 independent biological samples/pre- vs. post-differentiation). f, Odds ratio analysis of overlapping genes displaying differential H3K4me3Q5ser enrichment vs. differential gene expression (DEx, n=3 independent biological samples/pre- vs. post-differentiation, FDR<0.05 cutoff applied after adjusting for multiple comparisons). Insert numbers indicate respective p values for associations, followed by the number of protein-coding genes overlapping per significant category. Data are presented as averages ± SEM.