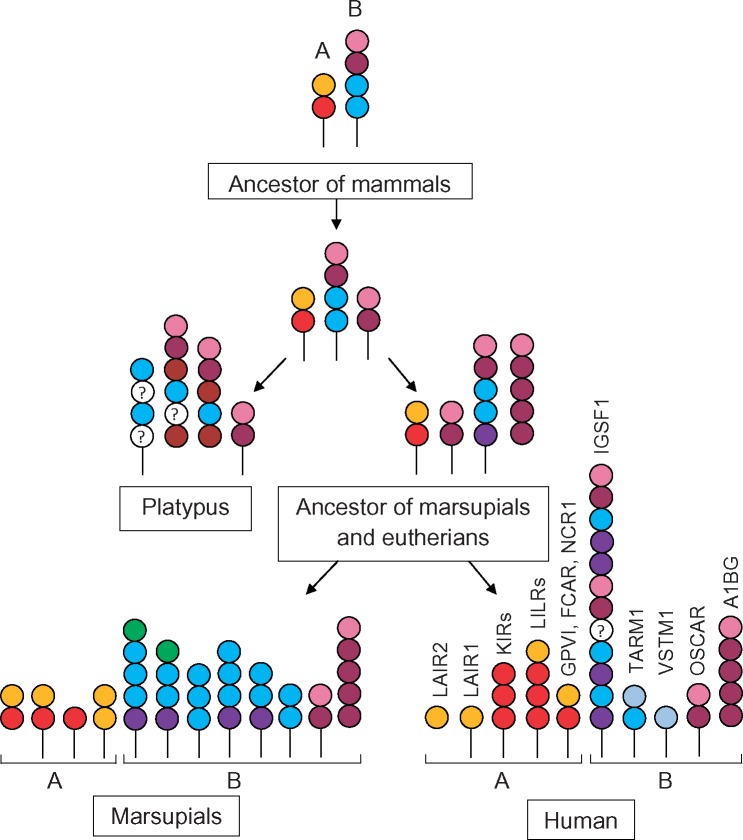
Fig. 10.
—A hypothetical scenario of the evolution LRC in mammals. A and B denote LRC classification into two groups. Domain subtypes distinguished by the phylogenetic analysis are shown by colored circles. The color scheme corresponds to the one used in the phylogenetic trees of individual domains (figs. 4, 7, and 8). Empty circles denote domain subtypes whose relationships were not resolved. In the marsupial lineage, only a fraction of predicted domain architectures is shown.

