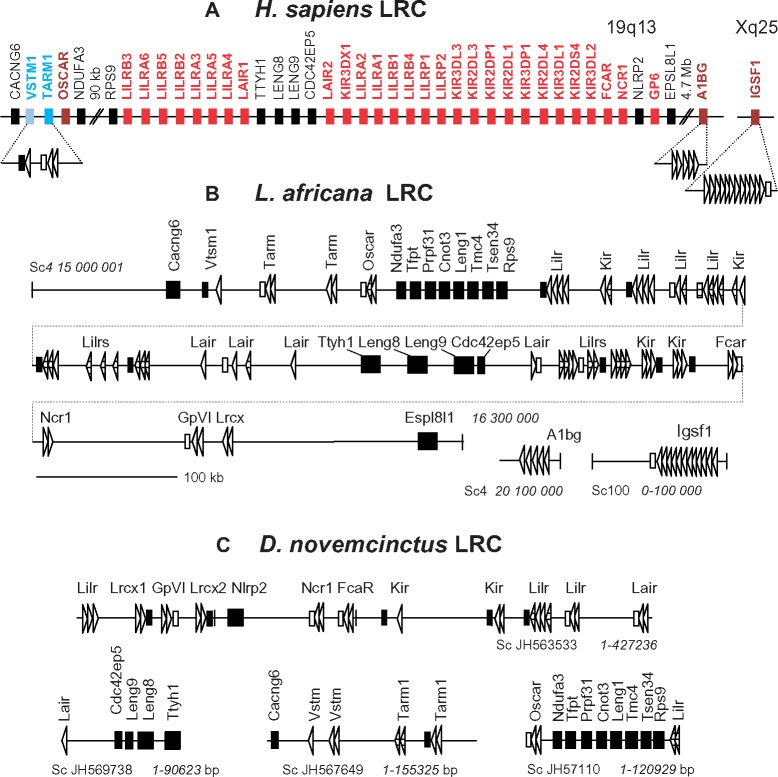
Fig. 3.
—Schematic representation of the LRC organization in the human (A), elephant (B), and armadillo (C) genomes. Italicized numbers show the position in a scaffold according to the current genome annotations at the Ensembl website. Exons for Ig-like domains are shown by triangles. The orientation of the exon-designating triangles corresponds to the transcription orientation. The attribution of the predicted genes is based on the results of the phylogenetic analysis (figs. 4 and 5). Non-LRC genes are shown by large black rectangles. Black bars show exons for TM regions without charged residues. Empty bars show exons for the NxxR-motif-containing TMs. Pattern-filled shapes show partially sequenced or aberrant exons.

