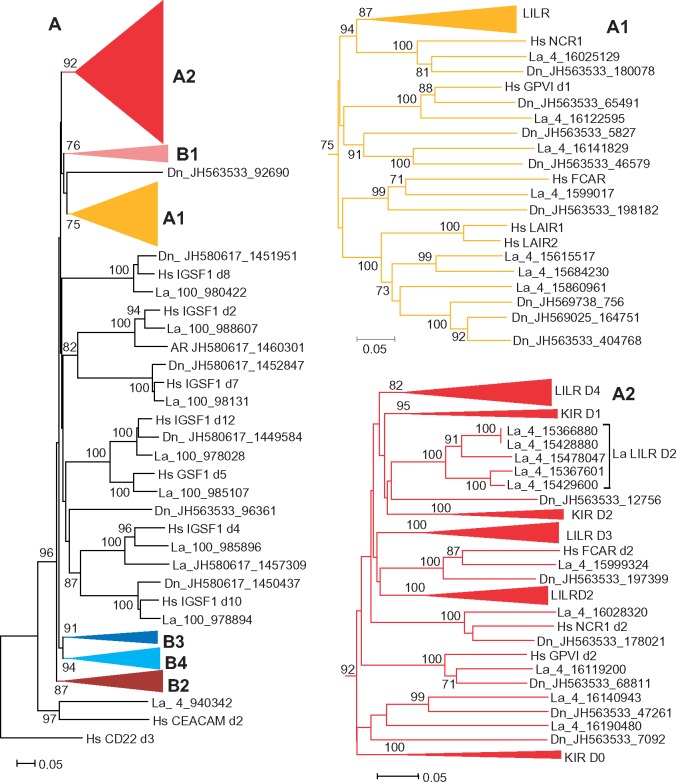
Fig. 4.
—Evolutionary relationships between the human (Hs), elephant (La), and armadillo (Dn) LRC molecules. (Left) NJ tree for individual LRC domains rooted with human CEACAM and CD22. To reduce the size of the tree, the clusters corresponding to certain domain subtypes were compressed and shown separately: A1 and A2 clusters are shown on the right, whereas B1–B4 are presented in figure 5. The trees were generated using MEGA6 software with p-distances for nucleotide sequence sites and pair-wise deletion option. The numbers on the tree nodes show values for the bootstrap tests after 500 replicates, the clusters for highly related Ig-like domains of various LILRs and KIRs were compressed and designated according to the domain subtype that they represent (D1–D4 for LILRs and D0–D2 for KIRs).

