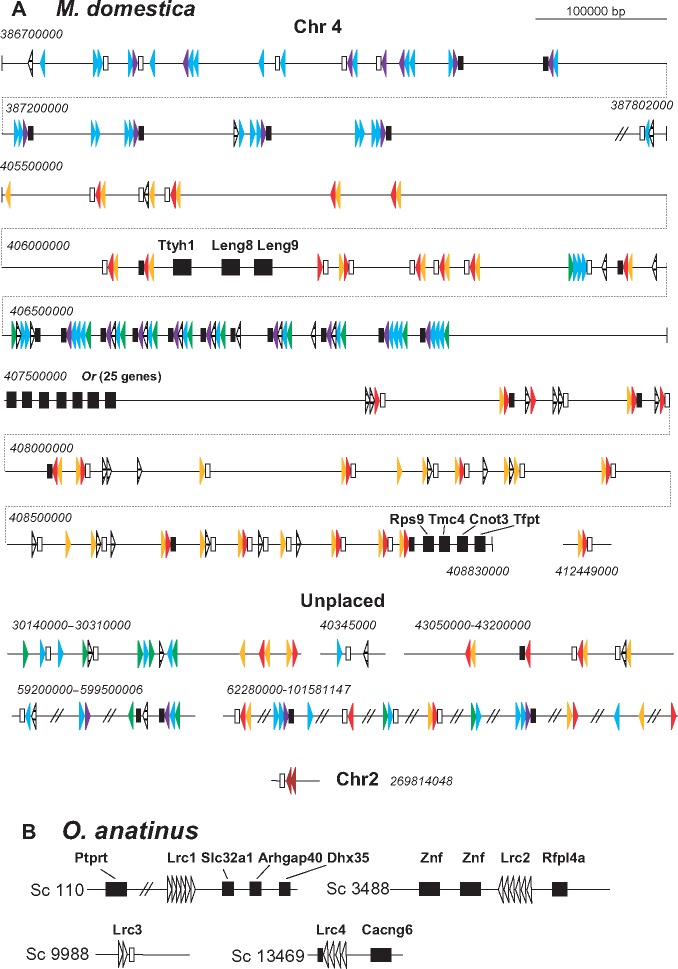
Fig. 6.
—Schematic representation of the LRC organization in the short-tailed opossum (A) and the platypus (B) genomes. Italicized numbers show position in a scaffold according to the current genome annotations at the Ensembl website. The colors of the opossum exons correspond to the color scheme of the phylogenetic tree in figure 7. The orientation of the exon-depicting triangles corresponds to the transcription orientation. Non-LRC genes are shown by large black rectangles. Black bars show exons for TM regions without charged residues. Empty bars show exons for the NxxR-motif-containing TMs.

