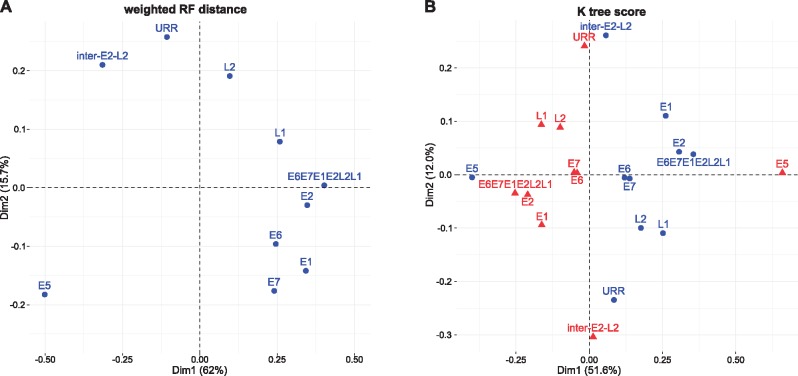
Fig. 2.
—Correspondence analysis of the weighted Robinson–Foulds (RF) tree distance (A) and the K-tree score (B) comparing maximum likelihood trees constructed for each of the PV ORFs, the concatenated E6E7E1E2L2L1 ORFs, the inter-E2–L2 region, and the URR. The weighted RF distance matrix is symmetrical and only one series of results are generated (blue symbols in panel A). For the K-tree score the distance matrix is not symmetrical and two series of results are thus generated when exchanging rows and columns, corresponding to the blue and red symbols in panel B). Values in parenthesis represent the percentage of total variance explained by the corresponding axis.

