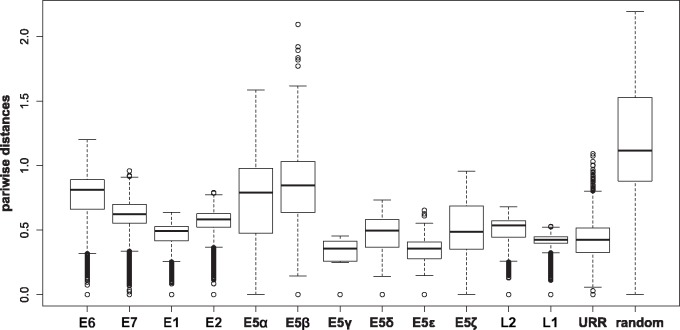
Fig. 5.
—Box and whisker plots of the pairwise distances between terminal taxa for the corresponding trees inferred for all genes encoded by AlphaPVs, the URR, and randomly generated intergenic CDSs. These random CDSs were generated by using the inter-E2–L2 region of the corresponding AlphaPV genome. For each distribution the median is labeled with a bar, the box encompasses the first and third quartile, and the whiskers cover the 95% confidence interval.

