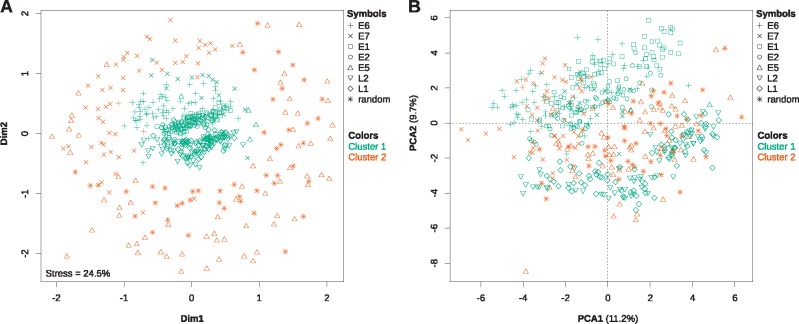
Fig. 6.
—Nonmetric multidimensional scaling analysis (A) and principal component analysis (B) of the codon usage preferences for all AlphaPV ORFs. Additionally, the ORFs were independently clustered by a hierarchical clustering algorithm based also on their codon usage preferences. The results from the best hierarchical clustering (two clusters) have been plotted onto both plots, with a color code as described in the legend. Grossly, cluster 1 consists of the E6, E1, E2, L2, and L1 genes, whereas cluster 2 consists of the E7 and E5 genes, and the randomly generated intergenic CDSs. The values for the total stress of the data explained by the MDS as well as for the percentage of the total variance explained by the each of the first two principal components are given in each plot.

