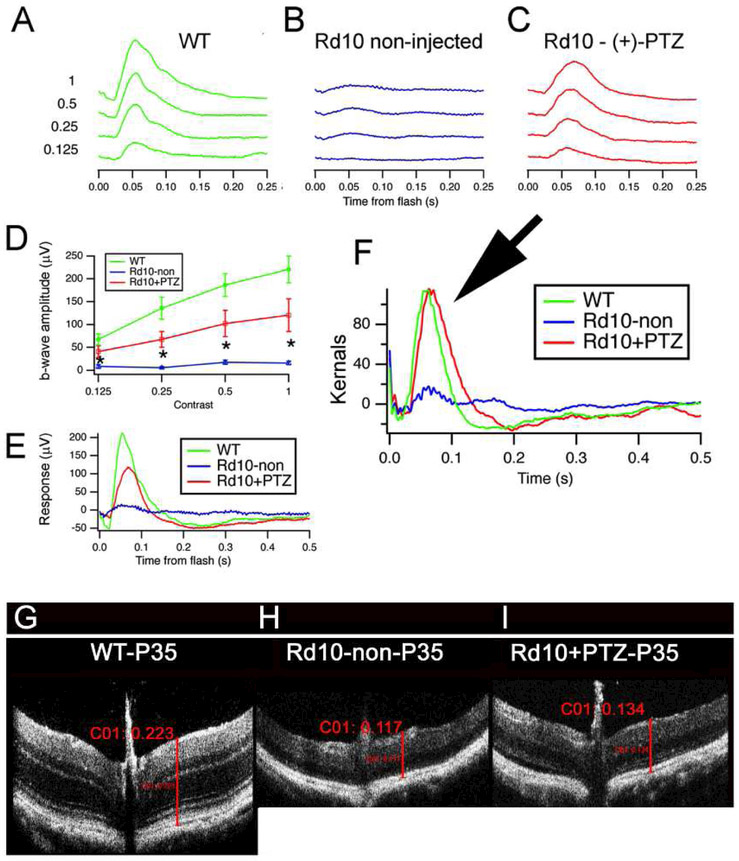
Fig. 5. Photopic ERG responses and SD-OCT are improved significantly in rd10 mice administered (+)-PTZ.
Averaged photopic responses to 5 ms flashes at a series of intensities (log photopic troland-seconds) are provided for (A) wildtype (WT), (B) rdl0-non-, (C) rd10+PTZ-treated mice (age: P35). (D) Mean b-wave amplitudes of averaged photopic responses to 5 ms flashes above fixed pedestal luminance of 0.105 lumens (4 contrasts of the flash; contrast = (Flash - Pedestal)/Pedestal luminance). Data are mean ± SEM of 4 assays using eyes from 6–9 mice (*significantly different between rd10-non-injected and rd10+PTZ-treated, ^<0.005). (E) Averaged responses to photopic flash of contrast = 1 (replotted after superimposition). A second type of ERG test that uses ‘natural luminance noise’ stimuli was used to evaluate cone function. (F) Averaged kernels derived from responses to natural noise stimuli. Note the very similar responses of rd10+PTZ mice compared to WT (arrow), which are significantly greater than rd10-non-treated mice. Panels G-I: Representative SD-OCT data obtained from WT mice, rd10-non-, rd10+PTZ-treated mice at P35. Total retinal thickness averaged respectively, 223pm, 117pm, and 134pm for wildtype, rd10-non-treated, and rd10+PTZ-treated mice. (Figures adapted from Wang et al, 2016B, with permission).

