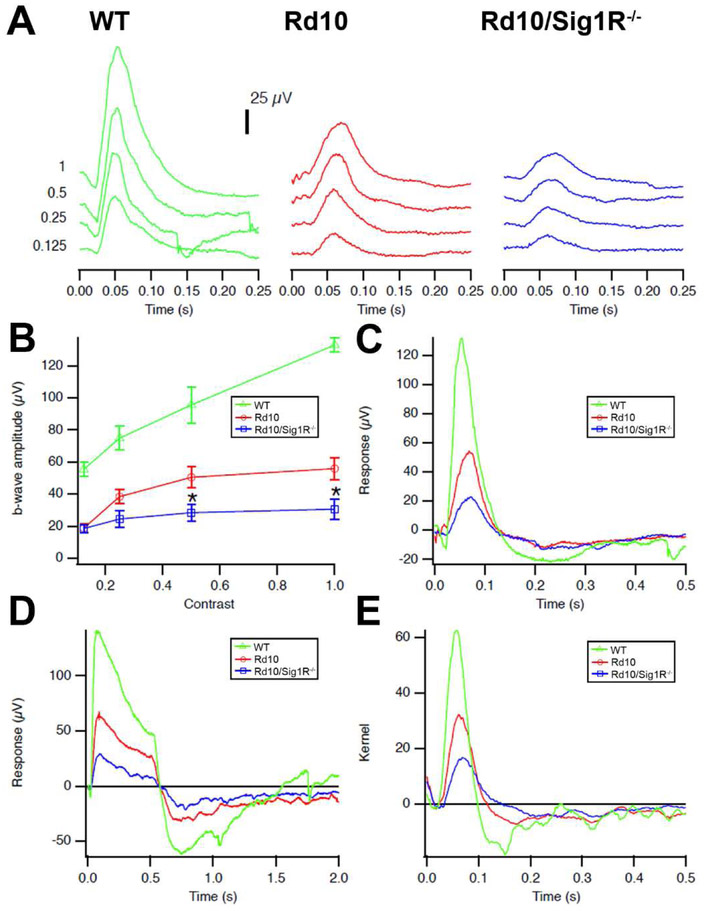
Fig 8. Photopic ERG and natural luminance noise test responses are diminished in rd10 mice lacking Sig1R.
(A) Photopic ERG traces. Averaged photopic responses to 5-ms flashes at a series of contrasts are provided for WT, Rd10, Rd10/Sig1R−/− mice at P28. (B). Mean b-wave amplitudes of averaged photopic responses to 5-ms flashes above a fixed pedestal luminance of 0.105 lumens [four contrasts of the flash; contrast = (flash-pedestal)/pedestal luminance]. Data are the mean ± SEM of four assays using eyes from six to nine mice. *, significantly different from the WT and rd10 groups, *p < 0.05. (C) Averaged responses to photopic flash of contrast =1 (replotted after superimposition). (D) Averaged responses to 0.5s long luminance steps are shown. The photopic negative response occurs after stimulus offset at 0.5s, and originates in part from RGCs. (E) Averaged kernels derived from responses to natural noise stimuli.

