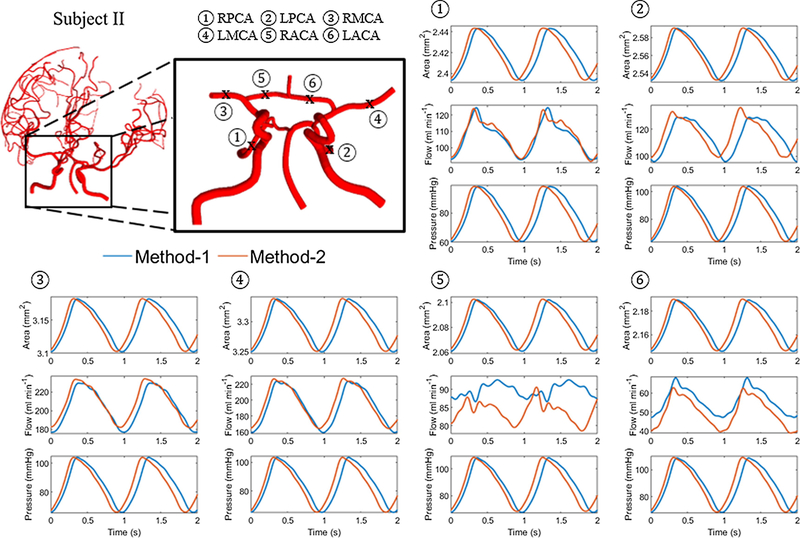
Figure 3.
Comparison of blood blow simulation results with method-1 and method-2. Area, A, flow, Q, and pressure, p, trajectories at the middle section of the vessel length (x = L/2) for the main vessels located in or branching from the circle of Willis for subject II. The blue and red lines represent methods-1 and 2 respectively. Modulation of the periodic waveform occur in method-2 simulations, probably due to reflections at the boundaries.

