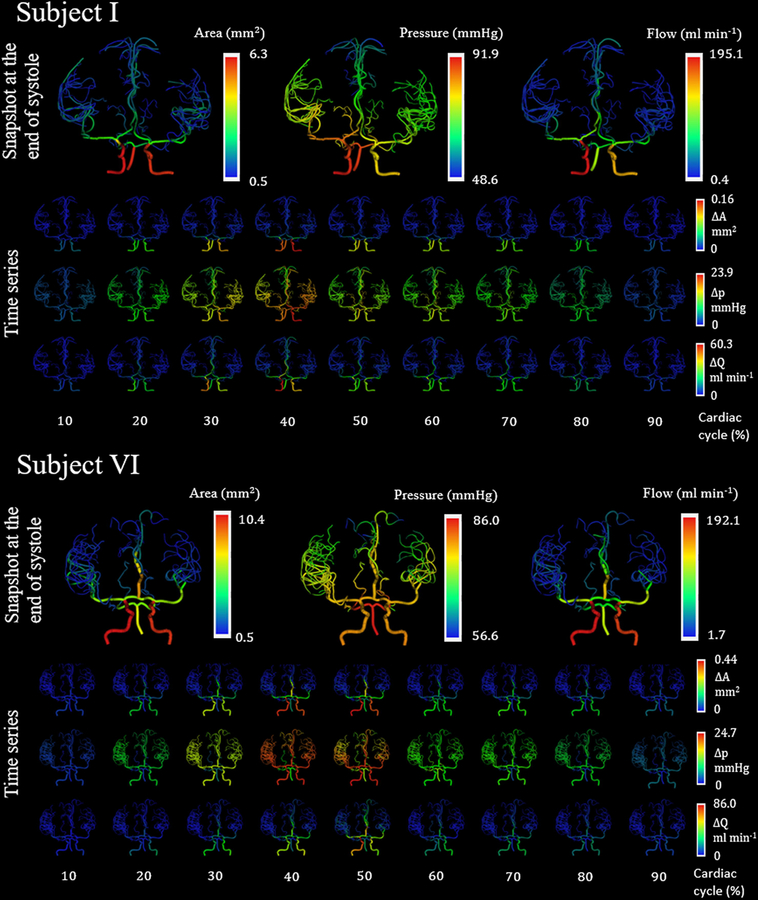
Figure 5.
Simulated hemodynamics in distensible blood vessels for human subjects I and IV for one cardiac cycle. The first row, for each subject, shows the diameter, flow and pressure distribution at the end of diastole with an elastic wall model. The second and third row shows the change in flow and pressure distribution, respectively, in each vessel from its respective baseline value at the different time points within a cardiac cycle represents the cardiac period.

