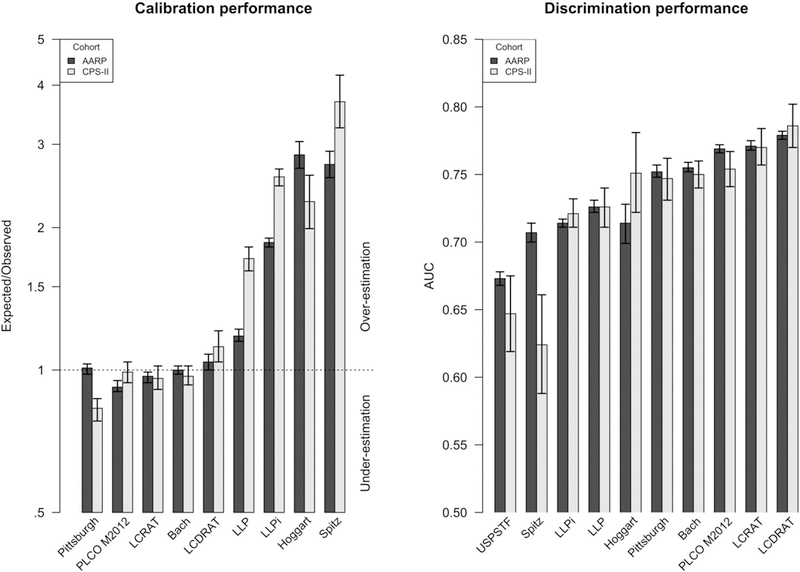
Figure 1: Calibration and discrimination of all 9 models in the NIH-AARP and CPS-II.

Abbreviations: NIH-AARP: NIH-AARP Diet and Health Study; CPS-II: Cancer Prevention Study II Nutrition Survey Cohort; USPSTF: US Preventive Services Task Force. PLCO M2012: Prostate, Lung, Colorectal, and Ovarian Screening Trial Model 2012; LCDRAT: Lung Cancer Death Risk Assessment Tool; LCRAT: Lung Cancer Risk Assessment Tool; LLP: Liverpool Lung Project Risk Model; LLPi: Liverpool Lung Project Incidence Risk Model.
Footnote: Expected/Observed ratios less than 1 indicate underestimation of risk and Expected/Observed>1 indicates overestimation. The Area Under Curve (AUC) statistic examines how well each model discriminates risks between individuals; AUC=1 indicates perfect model prediction and AUC=0.5 indicates poor model prediction equivalent to purely random selection.
AUC for the USPSTF criteria represents identifying lung cancer diagnoses within 5 years of enrolment.
