
Figure 3. Variation in the Annual Number of Cardiac Amyloidosis-related Hospitalizations by Geographic Region, 2000–2012.
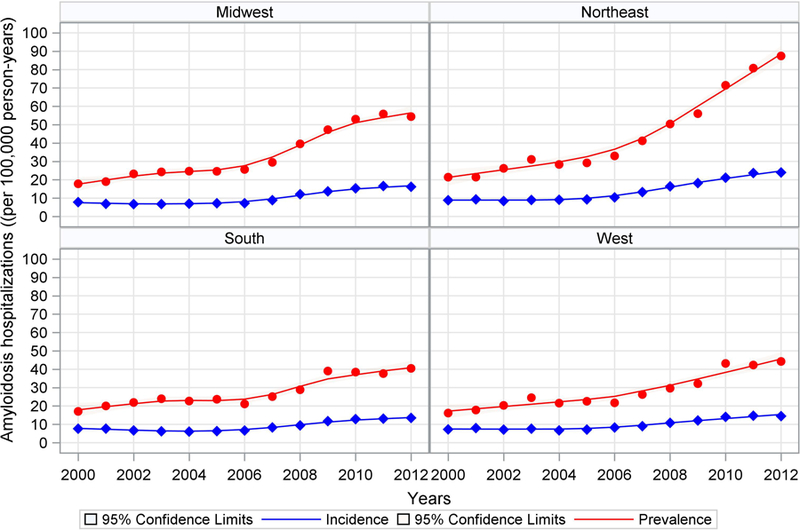
This figure shows the increasing frequency of all hospitalizaations (prevalence) and first hospitalizations (incidence) for cardiac amyloidosis by geographic regions between 2000 and 2012. The frequency of all hospitalizations increases in all geographic regions after 2006–2007. The steepest icnreases can be observed in the Midwest and Northeast. The red line shows the annual rate of all hospitalizations (prevalence) and the blue line shows the annual rate of first hospitalizations (incidence). The shaded areas represent the 95% confidence intervals.