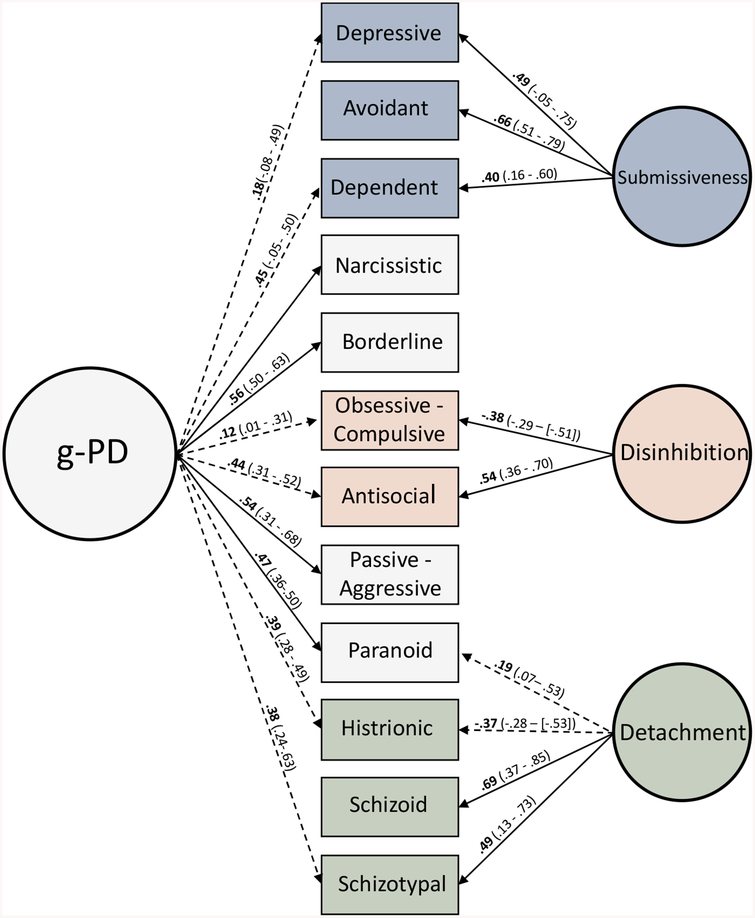
Figure 2.
Diagram of bifactor model. Observed variables refer to all indicators associated with that PD, not individual criteria. Only criteria loadings >|.30| are used for interpretation. Solid lines indicate primary loadings for half or more of criteria. Dashed lines indicate primary loadings for less than half of criteria. Bolded values are average loadings for each PD, range of loadings in parenthesis.

