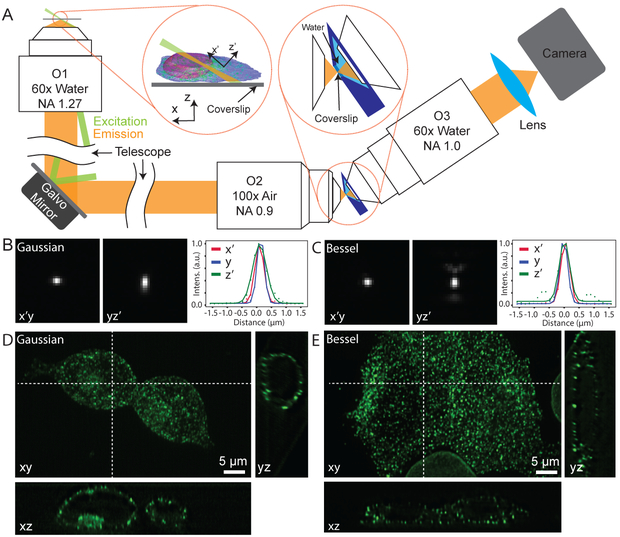
Figure 1.
Optical setup and spatial resolution of the system. (A) Schematic of the experimental setup. O1 is used for both illumination (shown in green) and fluorescence (shown in yellow) detection. A remote imaging module composed of two objective lenses O2 and O3 is used to image the oblique plane. A water container (shown in dark blue) in the focal space of O2 and O3 separates them by a glass coverslip, with one side being air medium and the other side water. Left inset shows the definition of the coordinate system. Right inset shows the detailed design of the remote imaging module. (B-C) PSF of the eSPIM with Gaussian and Bessel excitations, measured with 45 nm green fluorescent beads. Representative cross-sections of the PSF in the x’y-plane, in the yz’- plane and intensity plots along the three axes of a bead are shown. The FWHMs are 362.4 nm, 285.1 nm and 533.8 nm along the x’-, y- and z’- axes with Gaussian excitation, and are 346.3 nm, 309.5 nm, 408.9 nm along the three axes with Bessel excitation. (D-E) eSPIM images with Gaussian and Bessel excitations of a mixture of HEK 293T cells with endogenous clathrin A or lamin A/C labeled by mNG211 knock-in. Maximum intensity projection of the 3D dataset in the xy-plane is shown together with representative cross-sections in the xz-plane and in the yz-plane. B and C are raw data without deconvolution. D and E are data after deconvolution using the Richardson-Lucy algorithm with 10 iterations. At least five experiments were repeated independently with similar results for B-E.

