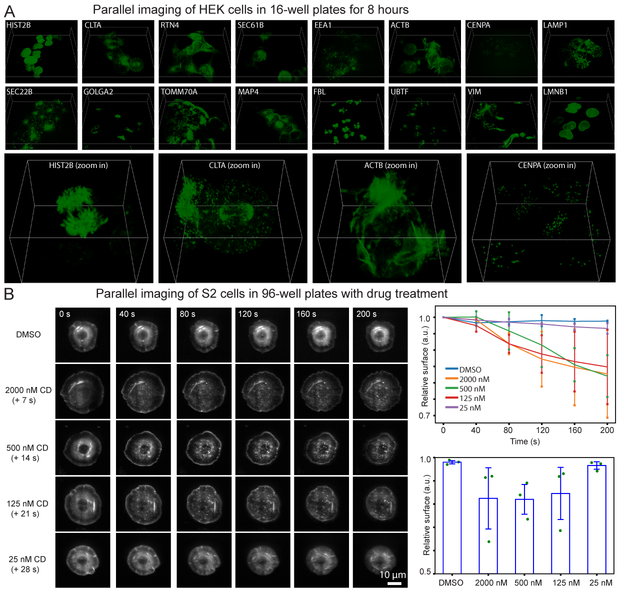
Figure 2.
Parallel volumetric live imaging of cells in multiwell plates. (A) HEK 293T cells were endogenously labeled with split mNeonGreen2. 3D views of a representative time point for each well are shown at the top. Four zoomed-in 3D views are shown at the bottom. The box sizes are 93.1 μm × 93.1 μm × 16.0 μm for the sixteen full field of view images, and 26.6 μm × 26.6 μm × 16.0 μm for the four zoomed-in images. Three experiments were repeated independently with similar results. (B) Drosophila S2 cells stably expressing mRFP-actin were treated with DMSO or Cytochalasin D, an inhibitor of actin polymerization. Representative max intensity projection images of the cells with different treatments and at different time points are shown. Right-top panel shows the normalized surface areas of the cells as a function of time. Right-bottom graph shows the surface areas change of the cells after treatment relative to before treatment. Values are averaged from three experiments, with error bars indicating the standard deviation. Green dots show all the data points.

