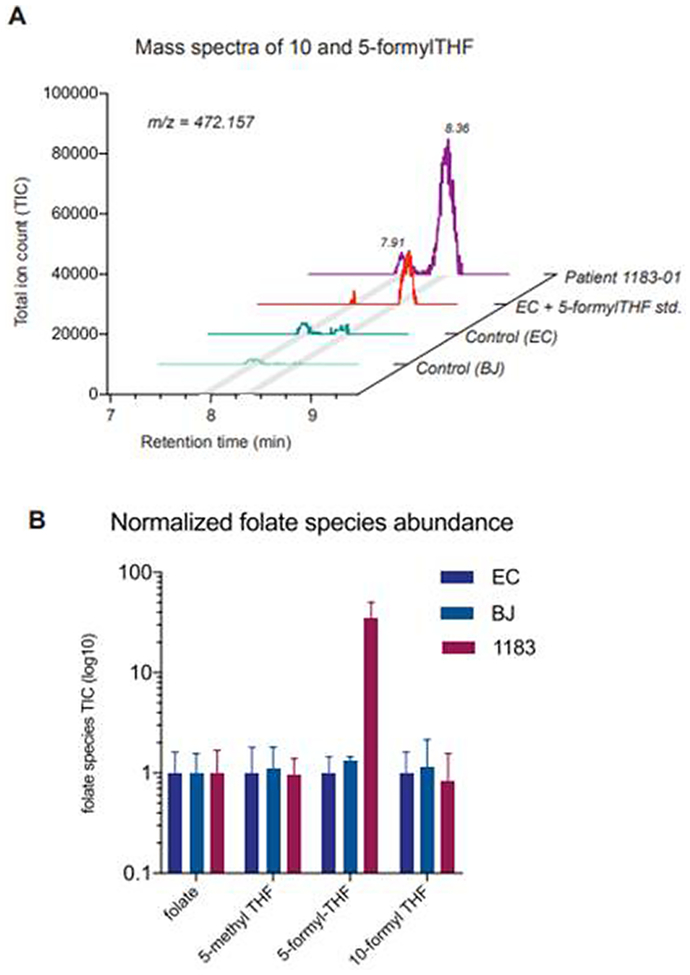
Figure 5.
5-formyl-THF accumulates in fibroblasts of the affected patient. (A) Total ion chromatogram (TIC) of m/z = 472.157 corresponding to the molecular weight of 5 and 10-formyl-THF. 2 peaks are present representing 10-formyl-THF (RT= 7.91 min) and 5-formyl-THF (RT= 8.36 min) species. (B) Normalized abundances of folate species in control (EC and BJ) and patient (1183–01) fibroblasts (mean ± stdev, n=3).

