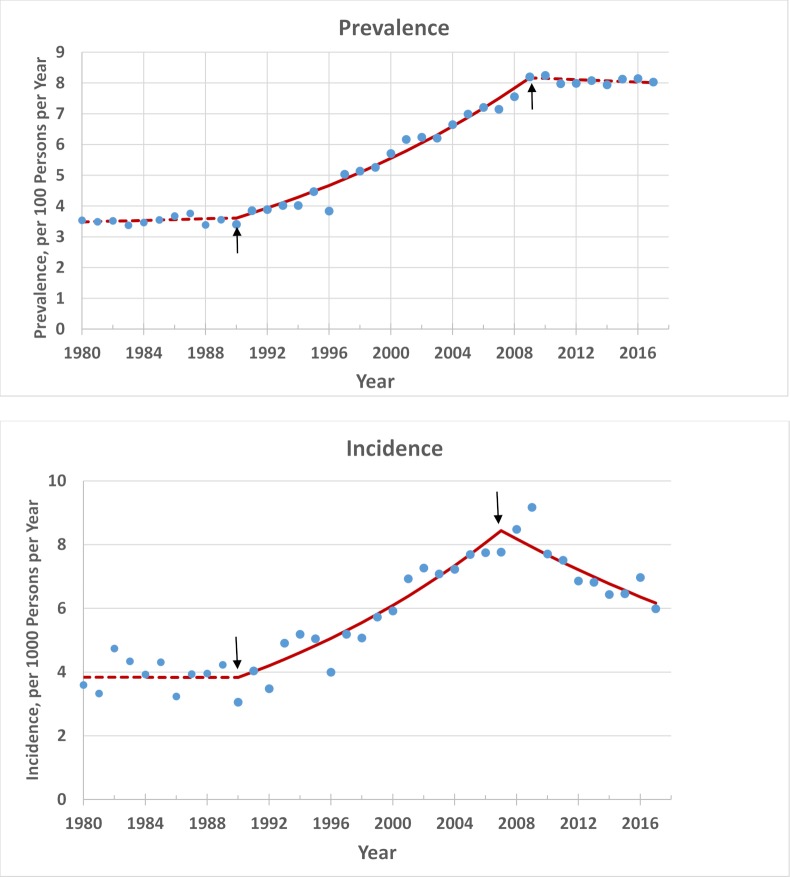
Figure 1.
Trends in age-adjusted diagnosed diabetes prevalence and incidence among adults aged 18–79 years, 1980–2017. Data are from the Centers for Disease Control and Prevention’s (CDC) National Health Interview Survey. Dots are observed annual values; the lines are modeled using Joinpoint Trend Analysis Software. The dotted lines indicate no significant trend; solid lines indicate a significant annual percentage change. Arrows indicate joinpoints (changes in trend). The 2000 US Census was used for age adjustment using age groups 18–44, 45–64, and 65–79 years.

