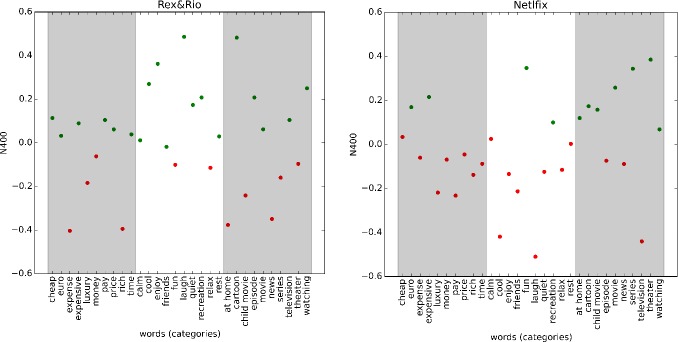
Fig 5. Clusters and categories representation.
N400 responses vs. words, colored according to the clusters (green versus red, Cluster 1 versus Cluster 2) and organized according to category (from left to right, Price, Relaxation, Television). Left panel: Rex&Rio associations. Right panel: Netflix associations.

