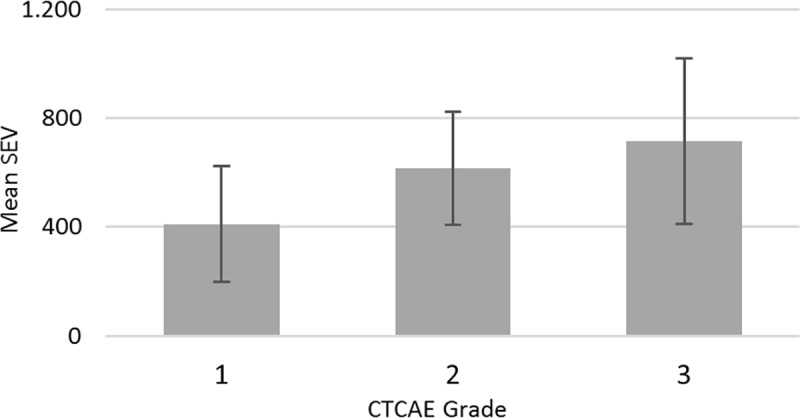
Fig 5. Comparison of CTCAE grade (according to radiation oncologist 1) and the mean SEV values.

Error bars show ± 1 standard deviation (SD). Mean difference between CTCAE grade 1 vs. 2 is SEV 205.6 (95%CI: 95.8–315.4; p<0.001), 1 vs. 3 is SEV 306.4 (95%CI: 76.4–536.4; p = 0.005) and 2 vs. 3 is 100.8 (95%CI: -124.7–326.3; p = 0.837).
