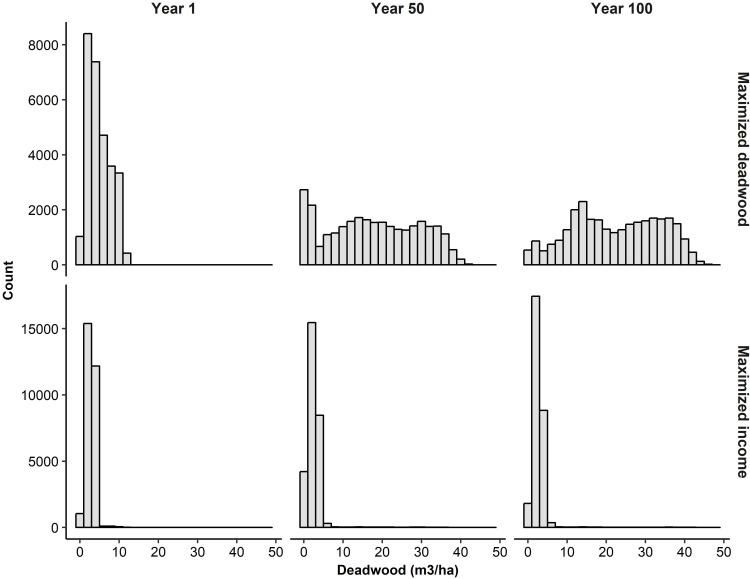
Fig 2. Development of deadwood availability.
Distributions of stand-level values of deadwood availability (m3 per ha) at the beginning, halfway, and end of the 100-year simulation period when deadwood availability was maximized without a harvest income constraint (top row) and when maximal harvest income was required (bottom row). Note that the x-axis are the same in all plots, but the y-axis differ between the top and bottom row.

