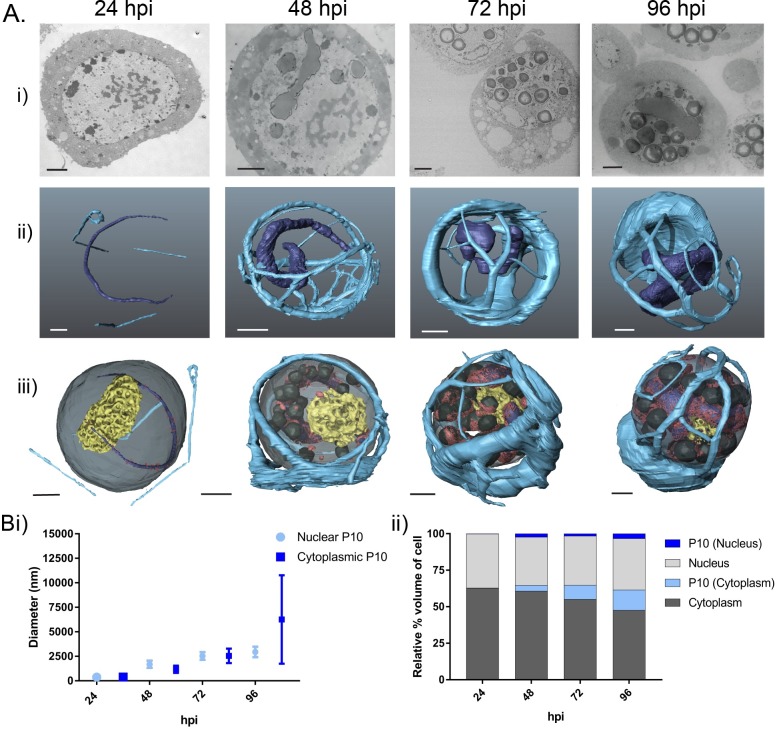
Fig 2. P10 structures in AcMNPV-infected TN-368 cells from 24 to 96 hours post-infection.
(Ai) SEM images of resin embedded AcMNPV-infected TN-368 cells from the sample block face using the Gatan 3View system and a Zeiss Merlin compact field emission gun SEM at 24, 48, 72 and 96 hpi (see S2 Table for imaging parameters). (Aii) Whole cell 3D reconstruction (AMIRA) of nuclear and cytoplasmic P10 structures: nuclear P10 (dark blue), cytoplasmic P10 (light blue). (Aiii) P10 structures as in (Aii), plus reconstructed representations of virogenic stroma (yellow), occlusion bodies (dark grey) and electron dense spacers (red). (B) Estimate of P10 structure size using volumetric modelling data. (Bi) Datasets showing size range, mean measurements (nm) and (Bii) relative percentage volume of P10 structures compared to total cell (n = 2).

