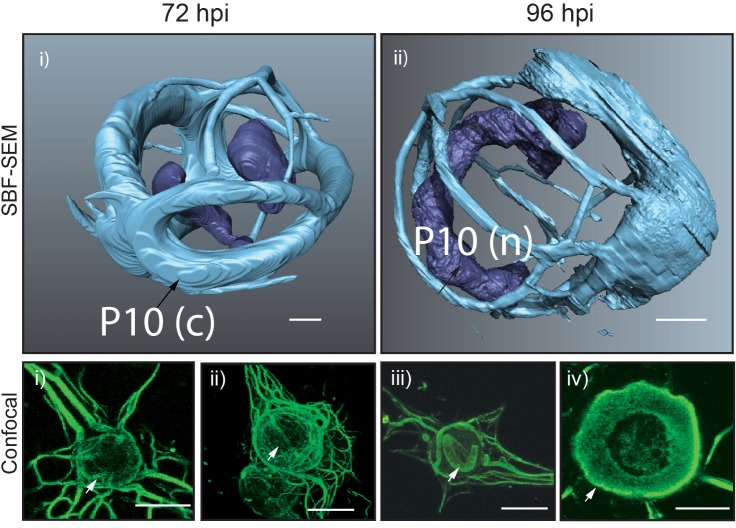
Fig 3. Surface generated images of AcMNPV-infected TN-368 cells at 72 hpi (i) and 96 hpi (ii) from SBF-SEM data sets.
Corresponding confocal microscopy images of AcMNPV-infected TN-368 cells at 72 hpi (i–ii) and 96 hpi (iii-iv). Black arrows (SBFSEM) and white arrows (confocal) highlight P10 (green) features. Scale bar 3 μm (SBF-SEM) and 20 μm (confocal). Infected cells were fixed at 96 hpi and stained by indirect immunofluorescence using an anti-P10 antibody. A secondary antibody conjugated to an Alexa-fluor 488 was used to visualise P10 structures.

