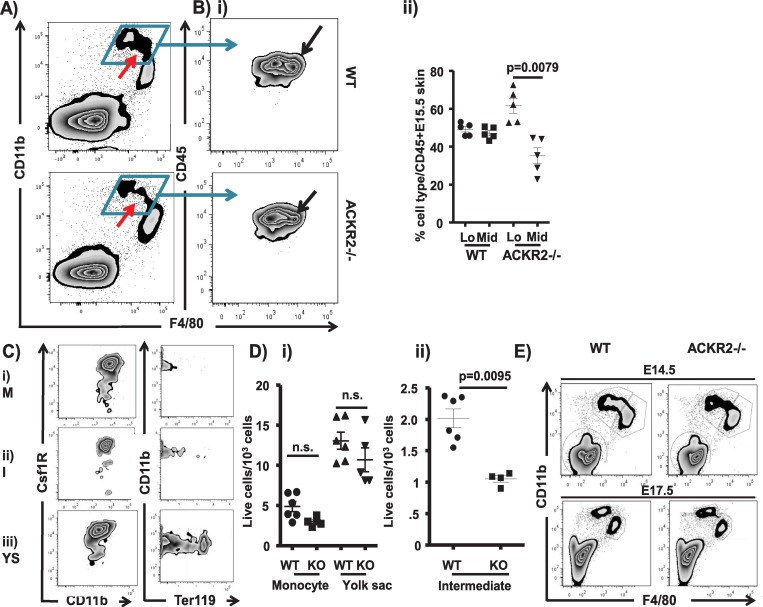
Fig 1. Monocyte/macrophage deficiency in ACKR2–/–embryonic skin.
A) Flow cytometry plot showing CD11b/F4/80 staining of CD45+ myelomonocytic cells in E15.5 WT and ACKR2–/–skin. The red arrow marks the intermediate population. B) i) Flow cytometric analysis of CD45/F4/80 staining in the total CD11bhi gate from skin of E14.5 WT (left-hand plot) and ACKR2–/–embryos (right-hand plot), showing a selective reduction in the F4/80Mid population (arrowed). ii) Quantitation of the percentage of F4/80lo and F4/80mid cells in WT and ACKR2–/–(KO) E15.5 embryonic skin. Results are representative of 2 separate experiments. Mann–Whitney U test was used for statistical analysis. C) Flow cytometric assessment of CSF1R and Ter119 staining of the i) monocyte (M), ii) intermediate (I), and iii) yolk-sac (YS)–derived cellular populations from E14.5 skin of MacGreen embryos. D) Quantitative assessment of multiple flow cytometric analyses showing numbers of i) monocyte- and yolk-sac–derived and ii) intermediate cells in E14.5 WT and ACKR2–/–(KO) skin. Results are from 1 of 4 independent experiments. Statistical analysis used the Mann–Whitney U test. E) Flow cytometric analysis of CD11b/F4/80 expression by CD45+ myelomonocytic cells from WT and ACKR2–/–(KO) skin at E14.5 and E17.5. Data are representative of at least 2 repeat experiments. Data were pooled from 3 independent experiments. Mann–Whitney test (monocytes) and unpaired two-tailed Student t test (yolk-sac–derived macrophages) were used for statistical analysis. Data associated with this figure can be found in the supplemental data file (S2 Data). ACKR, atypical chemokine receptor; CSF1R, Colony-stimulating factor 1 receptor; E, embryonic day; KO, knockout; WT, wild type.

