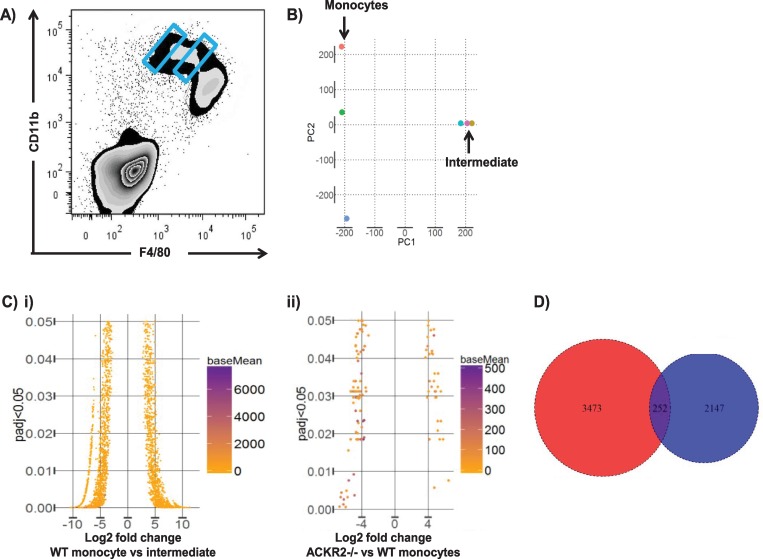
Fig 2. The intermediate cellular population is transcriptionally distinct from other embryonic monocyte/macrophage populations.
A) The E14.5 monocyte and intermediate populations were purified by BD index sorting with gating on the extremes of the CD11bhi population (as marked in blue). B) Principal component analysis showing the lack of transcriptional relatedness of the monocyte and intermediate populations. C) Funnel plots showing the extent of i) transcriptional differences between the monocyte and intermediate populations in WT embryos and ii) transcriptional relatedness between the residual monocyte population in ACKR2–/–skin and the equivalent population in WT skin. D) Venn diagram showing limited overlap in the genes identified as being differentially expressed between monocyte and intermediate cells in the current study (blue circle) and those identified as being differentially expressed between YS and bulk monocytic cells in a previous study (red circle) [14]. Data associated with this figure can be found in the supplemental data files S1 Data and S2 Data. ACKR, atypical chemokine receptor; BD, Becton Dickinson; E, embryonic day; padj, adjusted p value; WT, wild type; YS, yolk sac.

