Figure 3.

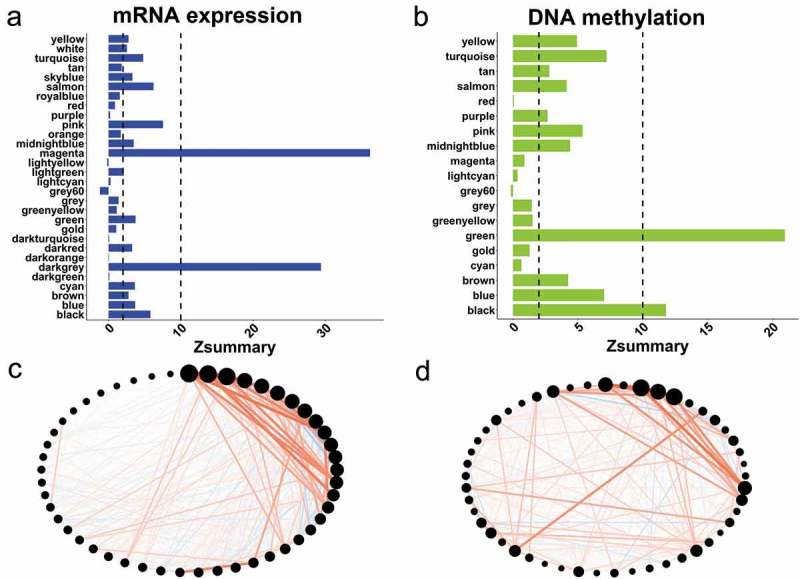
Module preservation in expression and methylation modules. (a) Bar graphs of the Z-summary statistic in co-expression networks using the methylation data set as the reference. The interpretation threshold for strong evidence (Z-summary > 10), moderate to weak evidence (2 < Z-summary < 10), and no evidence (Z-summary <2). (b) Bar graphs of the Z-summary statistic in co-methylation networks using the expression data set as the reference. The interpretation threshold for strong evidence (Z-summary > 10), moderate to weak evidence (2 < Z-summary < 10), and no evidence (Z-summary <2). (c) Co-expression patterns of genes overlapping in selected immune related modules. The red lines indicate the positive correlation between the genes (black dots), while line thickness indicates the strength of co-expression. The size of the dots represent the total connectivity of each gene. (d) Co-methylation patterns of genes overlapping in selected immune related modules.
