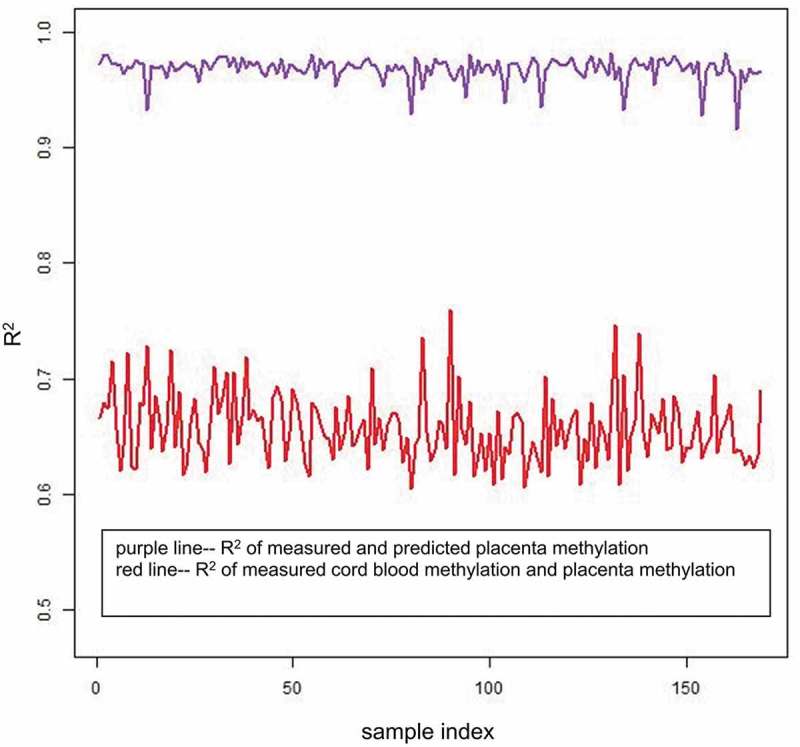
Figure 1.

R2 of the 169 samples. The x-axis represents the sample index from 1 to 169, and the y-axis represents the CpG-wise R2 of the 169 samples. The red line represents the CpG-wise R2 of measured methylation beta values in the cord blood and measured methylation beta values in the placenta, and the purple line represents the CpG-wise R2 of measured methylation beta values in the placenta and predicted methylation beta values in the placenta by single-CpG-based SVM and leave-one-out cross-validation.
