
Figure 4.
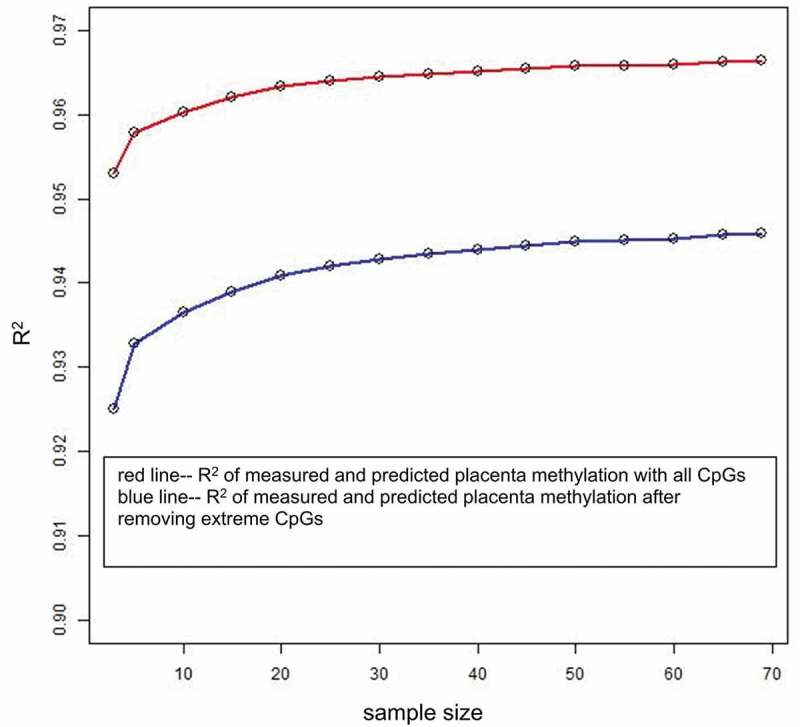
Effect of sample size on prediction accuracy. The x-axis is the sample size of the training dataset, and the y-axis is the mean of CpG-wise R2 for measured placenta methylation beta values and predicted placenta methylation beta values by single-CpG-based SVM for 100 testing samples. For the blue line, the extreme CpG sites with a minimum methylation beta value >0.8 or a maximum beta value <0.2 were removed.