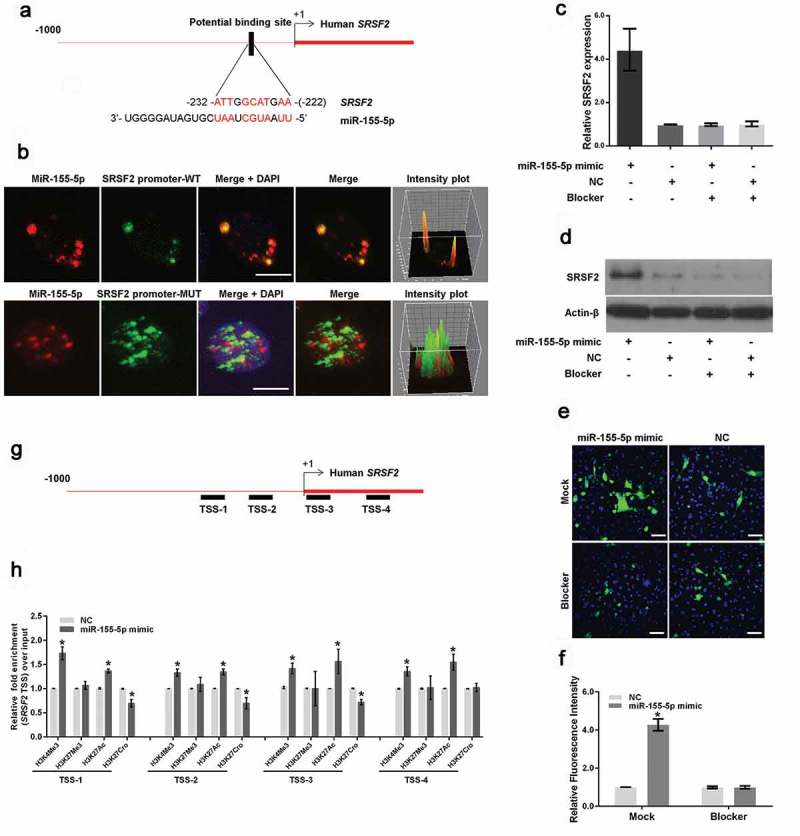
Figure 3.

MiR-155-5p interacts with the SRSF2 promoter. (a). Schematic representation of the miR-155-5p-binding site in the human SRSF2 gene. The black box shows the potential binding site, and the red characters indicate matching sequences. (b). HeLa cells were cotransfected with Cy3-labeled miR-155-5p (red) and FAM-labeled fragments of the SRSF2 promoter containing potential miR-155-5p binding motifs (green) or a fragment with a deletion in the miR-155-5p-binding motif (green). The cells were infected with HSV-1, fixed and subjected to a confocal microscopy analysis. The intensity plots of the red and green channels were analyzed with ImageJ software. DAPI (blue) was used to stain the nuclei. Scale bars, 10 μm. (c and d). 12 hours after transfection with the Blocker or Mock control, the HeLa cells were transfected with a miR-155-5p mimic or negative control and incubated for 24 hours. The SRSF2 expression levels were measured with real-time PCR (c) and western blotting (d). (e and f). 12 hours after transfection with the Blocker or Mock control, the HeLa cells were transfected with a miR-155-5p mimic or negative control for 24 hours, infected with HSV-1 for 12 hours, fixed, stained with an anti-HSV-1 glycoprotein antibody (green) and subjected to confocal microscopy analysis. DAPI (blue) was used to stain the nuclei (e). The fluorescence signal value was measured using the ImageJ software and normalized to a single cell. The data are normalized to the negative control level (f). (g). Schematic diagram showing the gene structure of SRSF2 in which the black boxes represent the primer-amplified regions. (h). HeLa cells transfected with the miR-155-5p mimics or negative control were collected for ChIP assays to analyze the relative fold enrichment of the SRSF2 promoter by an anti-H3K4Me3, H3K27Me3, H3K27Ac or H3K27Cro antibody. *p < 0.01.
