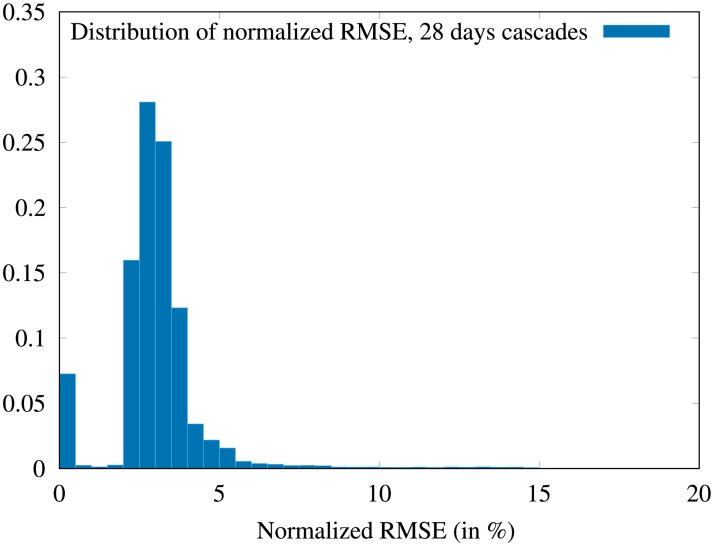
Fig 10. Distribution of the normalized root mean square errors.
The RMSE of the fits is computed over the sample of 4-weeks cascades, then it is normalized to the final value of the size of the cascade (nf). 5.7% of the cascades are filtered out as they are too small to provide a fit. We observe that 96.5% of the remaining cascades exhibit a normalized RMSE lower than 0.05.

