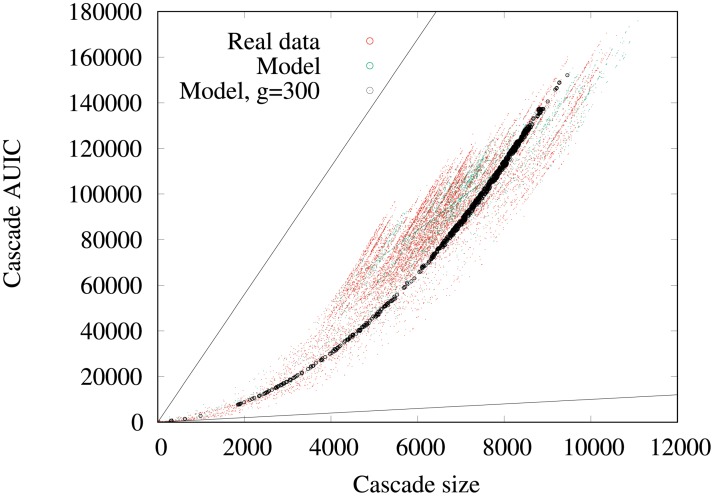
Fig 11. AUIC vs number of infected nodes (4-weeks): Model.
Scatter plot of the 4-weeks cascade sizes and AUIC in the 2-phase model. The black solid lines represent the theoretical boundaries, black dots correspond to model cascades with a similar linear growth rate (300 ± 5 holdings infected per day).

