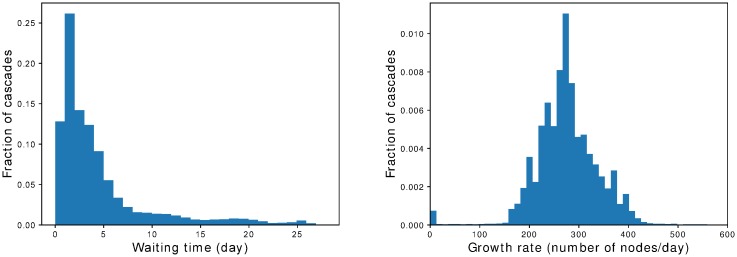
Fig 12. Waiting times and growth rates.
Normalized distributions of waiting times (left) and growth rates (right) of 4-weeks cascades, obtained when fitting n(t) with the two-phase model. While waiting times distribution is heterogeneous, growth rates are distributed homogeneously around approximately 280 infected nodes per day.

