
Figure 3.
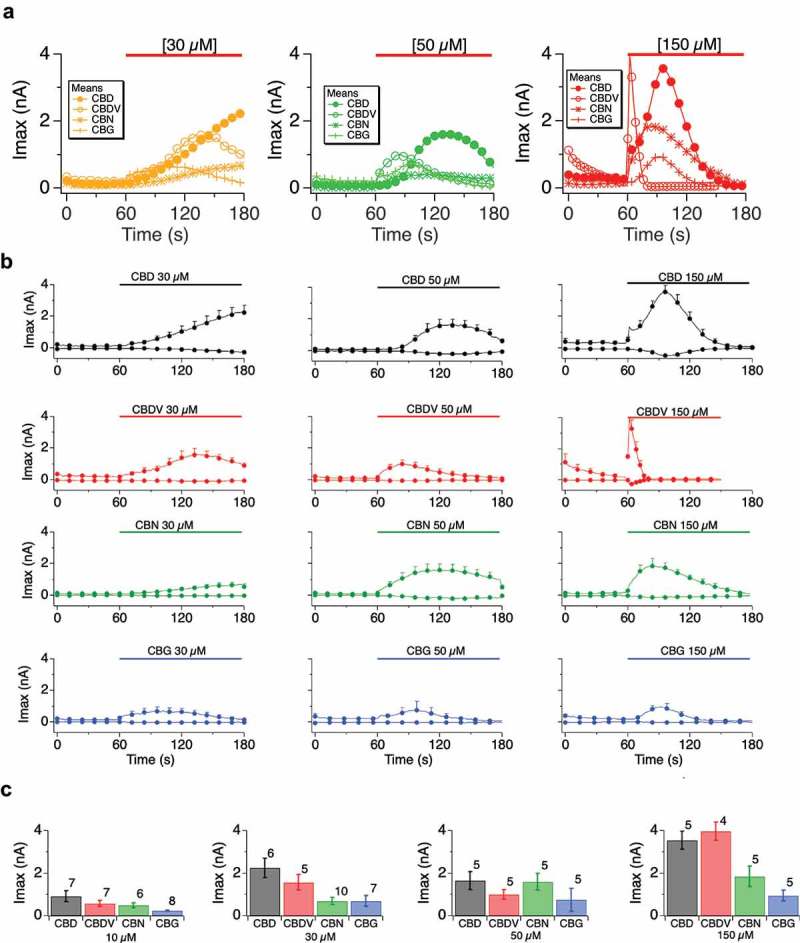
Comparative TRPV1 responses to different cannabinoids. A.
Current development over time (Imax, outward) for HEK-TRPV1 exposed for 120 s, starting at 60 s and ending at 180 s, to the indicated cannabinoids of CBD (closed circle), CBDV (open circle), CBN (asterisk) and CBG (cross). The color code for cannabinoid dose were: at 150 µM (red), 50 µM (green) and 30 µM (yellow). Panel B. data as in (A) by compound and by dose, individual; responses showing inward currents (from −80 mV) and outward currents (from +80 mV). C. Histogram summary of Imax data from (B). Recording conditions were NaR, Ca 1 mM with unbuffered internal calcium (Fca) and the n determinations varied from 5 to 8 patches and as indicated in panel C, bar graphs.