
Figure 4.
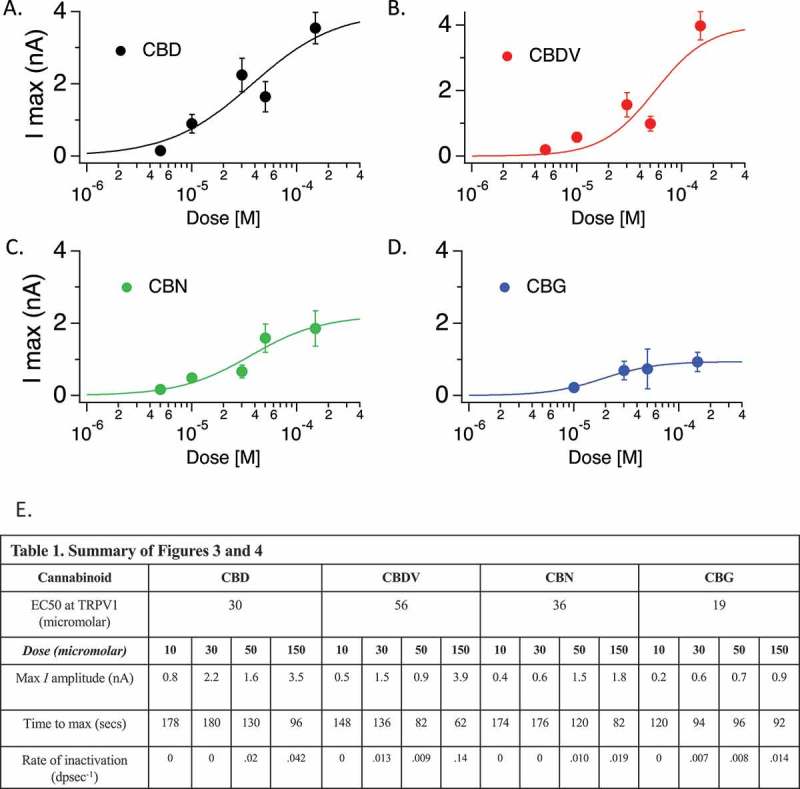
Cannabinoid dose response and EC50 calculation for TRPV1. A-D.
Hill plots for the indicated cannabinoids across dose rages tested. E. Table 1. Summary table of data from Figures 4 and 5. This table summarizes calculated EC50, and several features of the conductances at TRPV1 by compound and by dose.