
Figure 5.
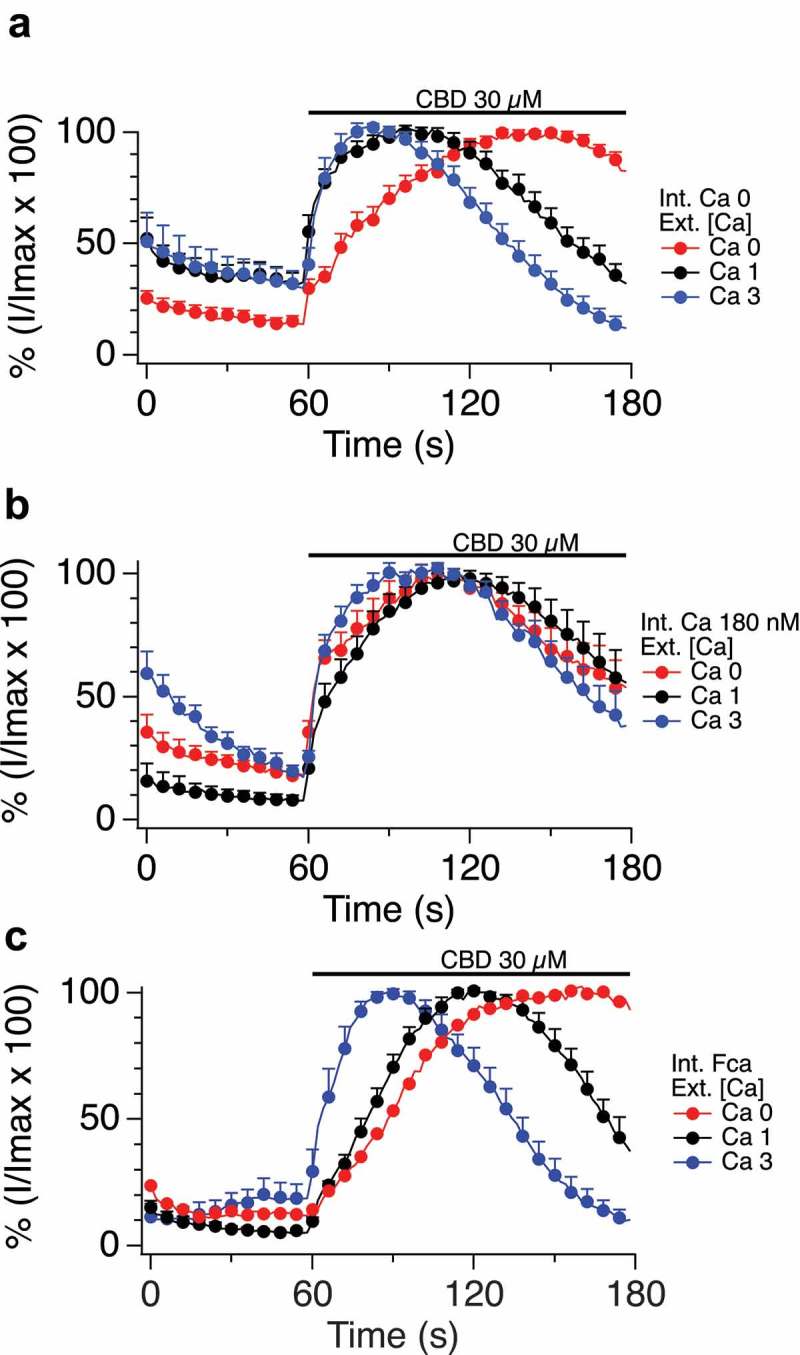
A-C. Impact of altered internal and external calcium levels upon CBD-induced TRPV1 currents.
Normalized current development graphs (percentage of Imax) for CBD at the indicated doses, recordings performed on 0, 1 or 3 mM external calcium with internal calcium buffered to zero, 180nM or allowed to be determined by influx (FCa, free calcium). D, E. Comparison of CBD and CBN responses in constant external calcium with varying internal calcium levels from Ca 0 to Ca 180 nM, 620 nM and FCa. F-I. Comparison of CBD and CBDV at low and high doses in 0 and 1mM external calcium with internal calcium buffered to 0, 180 nM, 620 nM, and FCa. The n determinations for Figure 5 (panels A to I) varied from 6 to 14 patches. J. Table 2. Figure 5 data summary.