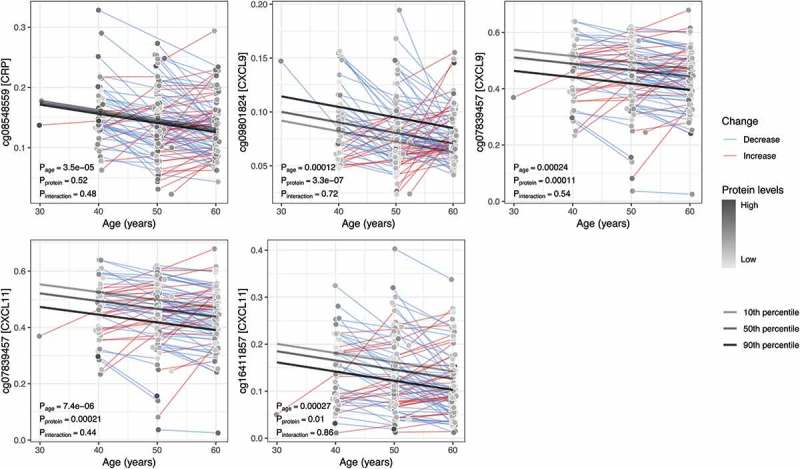
Figure 2.

Average within-individual age trajectories for CpG methylation levels. The CpG sites shown demonstrated an association between methylation and levels of an inflammatory protein (in square brackets on the y-axis), as well as a significant change over time (P < 0.0005). Average within-individual age trajectories were estimated in mixed models, including interaction terms between age and the mean protein levels over the two measurements. Marginal effects, depicted as regression lines, were estimated for ages 30 to 60 by the 10th, 50th, and 90th percentiles of the mean inflammatory protein levels.
