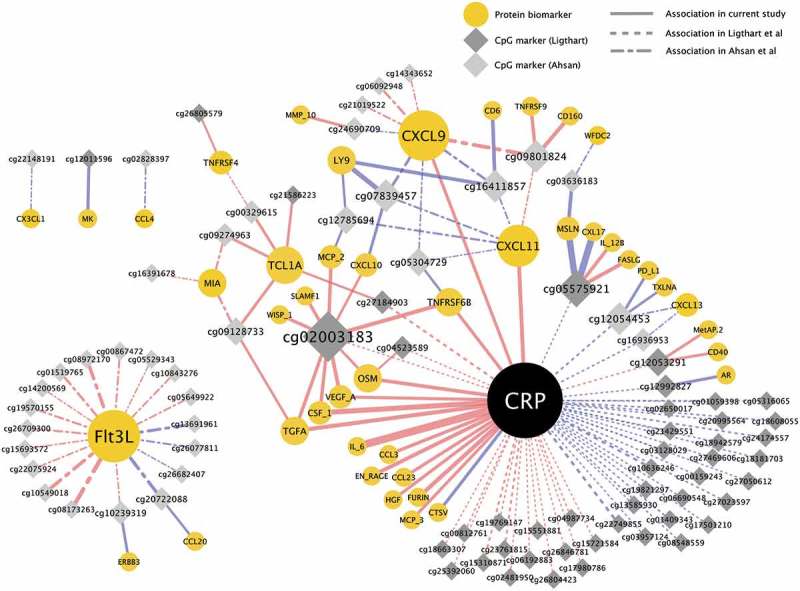
Figure 3.

Network of associations between DNA methylation, CRP, and other protein biomarkers. Associations were estimated with mixed models, adjusted for age, sex, case-control status, BMI, smoking status, and technical covariates. Node size corresponds to number of associations (edges). Edge size corresponds to association strength measured as contribution to explained CpG methylation variance by adding the protein biomarker to the model. Edge color represents direction of association, red = positive, blue = negative association. Full network showing all Ligthart et al. [9] CRP-associated CpG sites and Ahsan et al. [10] protein-associated CpG sites available in the study, and all other associations with P < 0.0005 in the current study.
