
Figure 1.
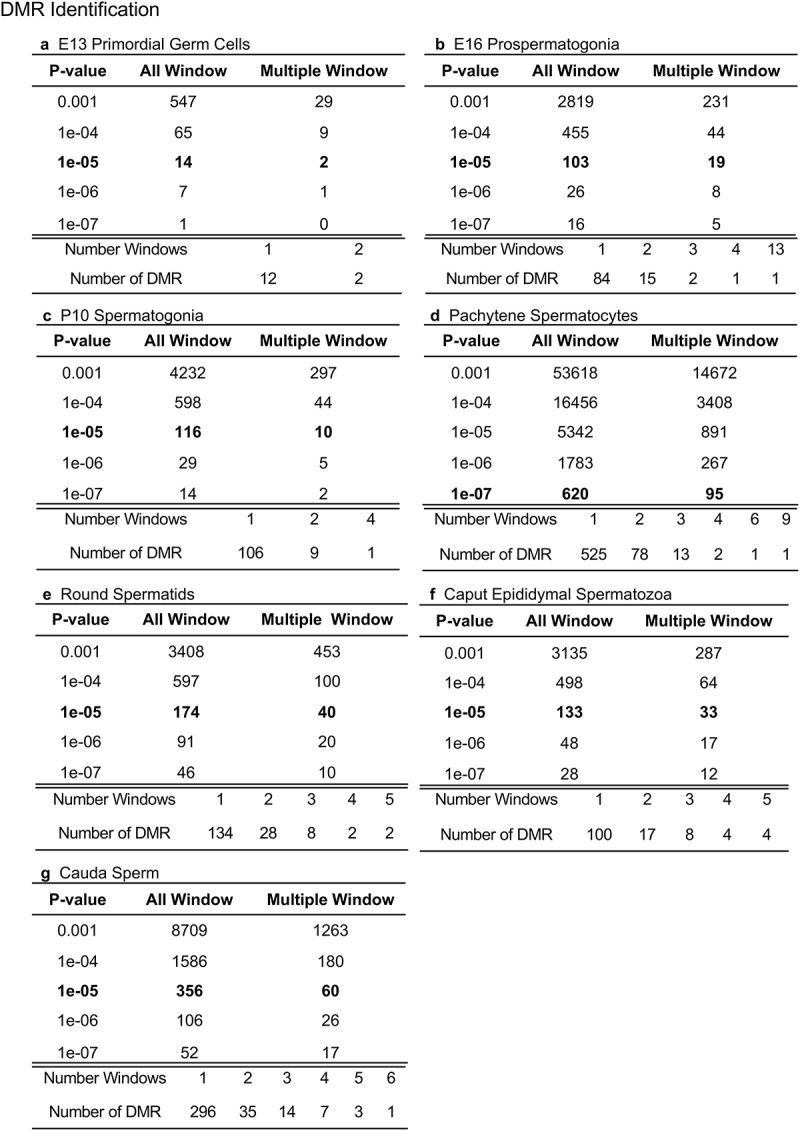
DMR analysis. The number of DMRs found using different p-value cut-off thresholds. The All Window column shows all DMRs. The Multiple Window column shows the number of DMRs containing ≥2 significant windows. The number of DMR with the number of significant windows at a p-value threshold bolded is presented. (a) E13 primordial germ cells. (b) E16 prospermatogonia. (c) P10 spermatogonia. (d) Pachytene spermatocytes. (e) Round spermatids. (f) Caput epididymal spermatozoa. (g) Cauda sperm.